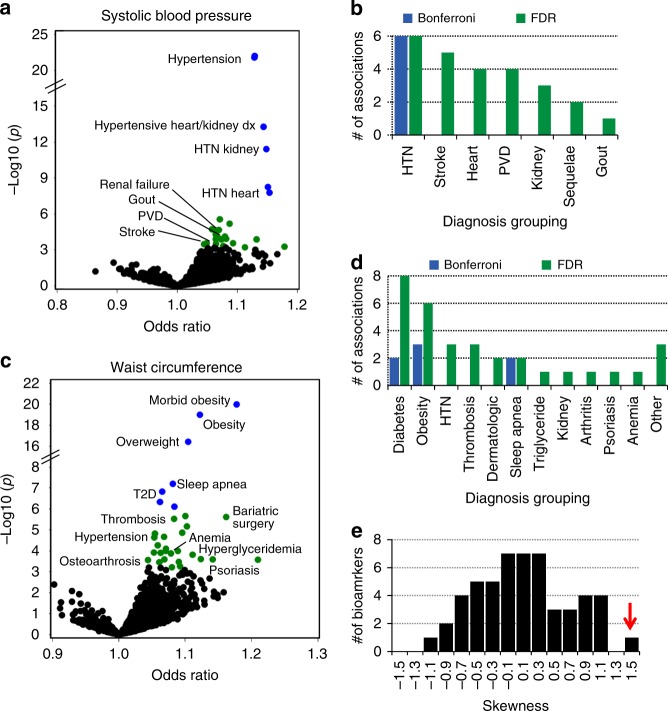
Fig. 3.
Comparison of an FDR versus Bonferroni p value selection threshold. a Scatter plot summarizing pheWAS analyses for a genetic predictor of systolic blood pressure (SBP). Each point indicates a logistic regression association analysis, adjusted for birth decade, sex, and 3 PCs, between genetically predicted waist circumference and a pheWAS phenotype. Odds ratios are per standard deviation increase in the genetic predictor. Blue and green colored circles denote associations that are significant at Bonferroni p < 0.05 and FDR q < 0.1, respectively. Only selected points are labelled for clarity. b Count of the number of associations, binned by disease, meeting a Bonferroni, and FDR selection thresholds. c PheWAS associations for a waist circumference genetic predictor and d count of disease associations significant by Bonferroni or FDR criteria. e Frequency histogram of the skewness (see Methods for calculations) of the pheWAS beta coefficients for each of the 53 biomarkers. The red arrow points to the value for waist circumference. HTN: hypertension; PVD: peripheral vascular disease; T2D: type 2 diabetes

