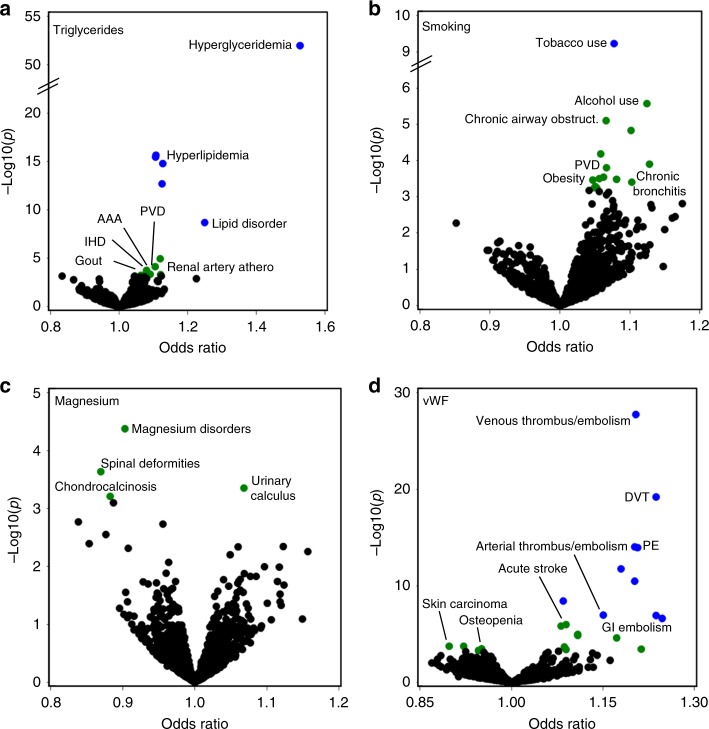
Fig. 4.
Associations for selected biomarkers. Scatter plots summarizing pheWAS analyses for genetic predictors of a triglyceride levels, b pack-years of smoking, c serum magnesium levels, and d serum Von Willebrand factor levels. Odds ratios are from logistic regression analyses, adjusting for birth decade, sex, and 3 PCs. Blue and green colored circles denote associations that are significant at Bonferroni p < 0.05 and FDR q < 0.1, respectively. PVD: peripheral vascular disease; AAA: abdominal aortic aneurysm; IHD: ischemic heart disease; DVT: deep vein thrombosis; PE: pulmonary embolism; GI: gastrointestinal

