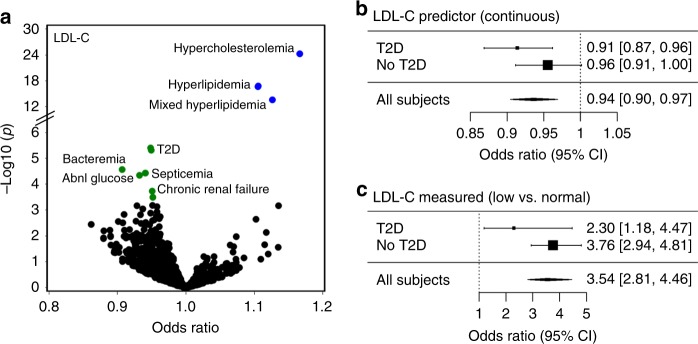
Fig. 5.
Associations with LDL cholesterol (LDL-C). a Scatter plot summarizing pheWAS analyses for a genetic predictor of LDL-C. Blue and green colored circles denote associations that are significant at Bonferroni p < 0.05 and FDR q < 0.1, respectively. b Association analysis between the LDL genetic predictor and the PheWAS septicemia phenotype, stratified by type 2 diabetes (T2D) status. Error bars represent 95% confidence intervals of odds-ratio estimates. c Epidemiological association between the Low (LDL-C < 60 mg/dl) versus Normal LDL-C (between 90 and 130 mg/dl) and septicemia, stratified by T2D status, using an independent EHR cohort. Odds-ratios were determined by multivariable logistic regression adjusting for age, gender and race and stratified by T2D status. Error bars represent 95% confidence intervals. T2D type 2 diabetes

