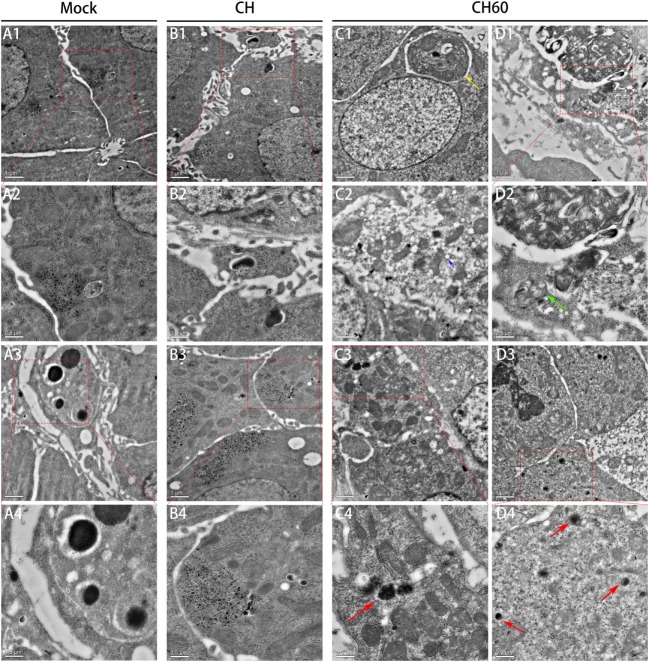
Figure 2.
Transmission electron microscopy analysis of liver tissue of the mock, CH and CH60 groups at 48 hpi. A: mock group; A2 and A4 are magnifications of the red boxes in A1 and A3, respectively. B: CH group. B2 and B4 are magnifications of the red boxes in B1 and B3, respectively. C and D: CH60 group. C4, D2, and D4 are magnifications of the red boxes in C3, D1, and D3, respectively.

