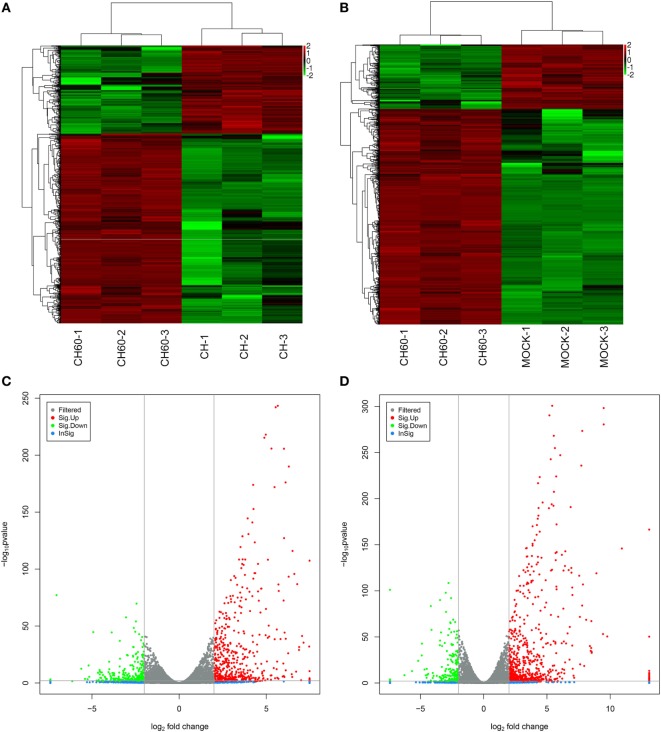
Figure 4.
Analysis of differentially expressed genes (DEGs) of the mock, CH, and CH60 groups (p-value < 0.01 and fold change > 4). A heatmap was used to classify the gene expression patterns, and a volcano plot displayed the number of DEGs. (A,B) The x-axis represents the experimental conditions. (C) Volcano plot of DEGs between the CH and CH60 groups. (D) Volcano plot of DEGs between the MOCK and CH60 groups. The y-axis indicates the negative logarithm of the p-value; the x-axis indicates the base 2 logarithm of fold change.

