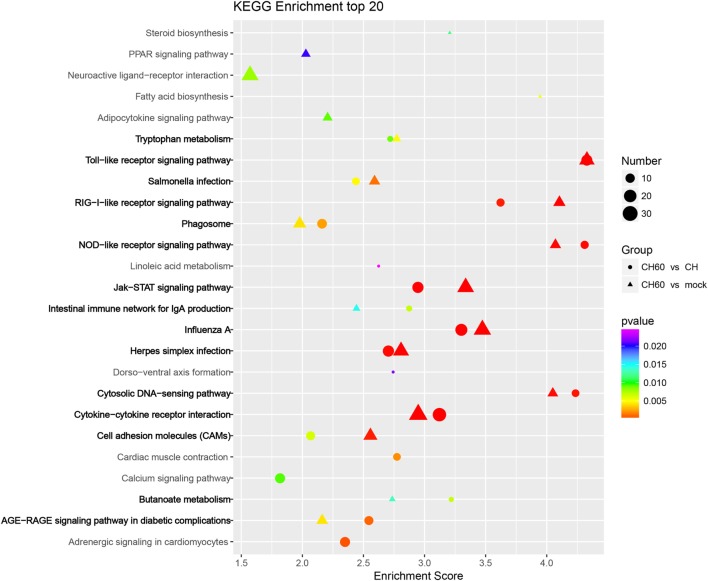
Figure 6.
KEGG enrichment analysis of differentially expressed genes (DEGs) (p-value < 0.01 and fold change > 4). Circles and triangles represent KEGG enrichment analyses of the DEGs between the CH and CH60 groups and the DEGs between the mock and CH60 groups, respectively. The colors of the circles and triangles indicate p-value; the sizes indicate the number of genes assigned to the term.

