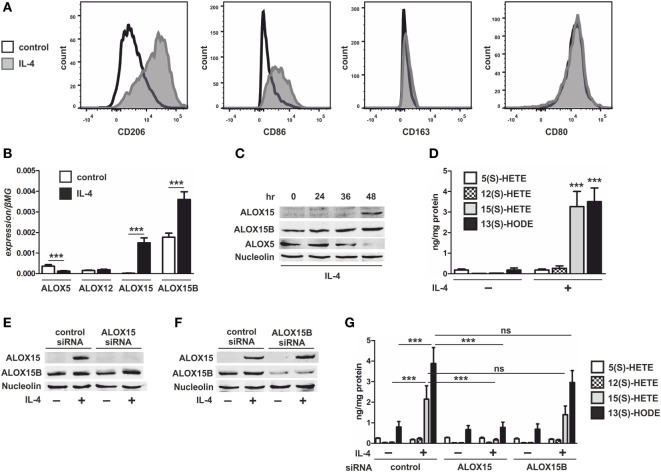
Figure 1.
Lipoxygenase expression in interleukin-4 (IL-4)-stimulated macrophages. (A) Flow cytometric analysis of CD206, CD86, CD163, and CD80 (B) and mRNA expression of 5-lipoxygenase (ALOX5), 12-lipoxygenase (ALOX12), 15-lipoxygenase (ALOX15), and 15-lipoxygenase, type B (ALOX15B) in primary human macrophages treated with 20 ng/ml IL-4 for 48 h. P-values were calculated using two-tailed Student’s t-test. (C) Western analysis of ALOX15, ALOX15B, and ALOX5 expression in macrophages treated for indicated times with IL-4. (D) LC-MS/MS analysis of arachidonic acid metabolites 5-HETE, 12-HETE, 15-HETE, and linoleic acid (LA) metabolite 13-HODE in macrophages treated for 48 h with IL-4. P-values were calculated using two-tailed Student’s t-test. (E,F) Western analysis of ALOX15 and ALOX15B expression in macrophages transfected with control and ALOX15 (D) or ALOX15B (E) siRNAs 24 h prior to treatment with IL-4 for 48 h. (G) LC-MS/MS analysis of arachidonic acid metabolites 5-HETE, 12-HETE, 15-HETE, and LA metabolite 13-HODE in macrophages transfected with control, ALOX15, or ALOX15B siRNAs 24 h prior to treatment with IL-4 for 48 h. P-values were calculated using one-way ANOVA with Bonferroni post hoc means comparisons with significance level set at 0.05. ***P < 0.001. Data are mean values ± SE of at least three independent experiments.

