
FIGURE 1.
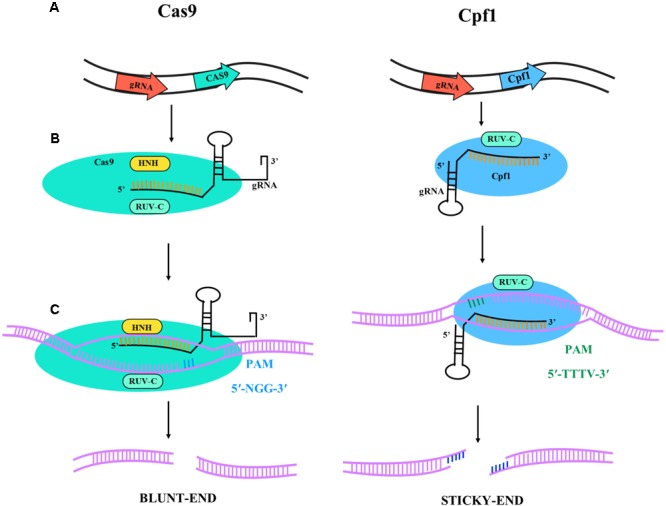
Illustrative diagram of Cas9 and Cpf1 activities. The target specificity is given by the 17-20 nt located at the 5′ end of the sgRNA sequence. (A) Primary transcript and gRNA-nuclease (Cas9 or Cpf1) complex formation. The catalytic domains are RUV-C (light blue) and HNH (yellow) for Cas9 and RUV-C for Cpf1. The Cas9 is colored in light blue and the Cpf1 in dark blue; in black is represented the gRNA for gene targeting. (B) Gene target activity. Cas9 has 5′-NGG-3′ PAM sequence (blue bars) and Cpf1 has 5′-TTTV-3′ PAM sequence (green bars). (C) DNA ends after nuclease activity. Cas9 lead to blunt-end and Cpf1 to sticky-ends.