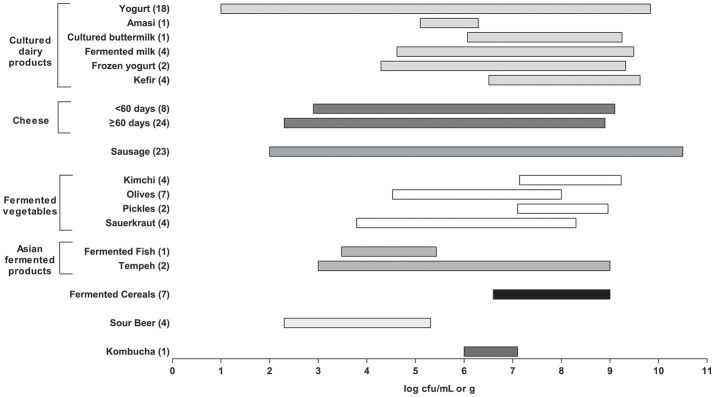
Figure 1.
Summary of lactic acid bacteria (LAB) counts in all fermented foods as reported in Tables 1–8. The bar plots represents a range (minimum to maximum) of counts found across the studies surveyed. The number of studies used here for each fermented food is shown in brackets. Products were excluded if they had no viable counts or when LAB counts were not reported. For yogurt, initial counts were used for products that had counts for more than one timepoint. For cheese, the products were divided by aging time (60 days) and were excluded if aging time was not reported.

