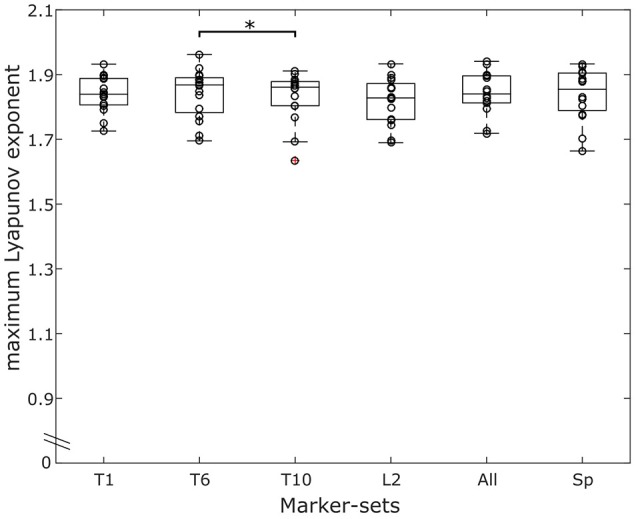
Figure 5.

Overlaying graphs of boxplots and scatterplots depicting the maximum Lyapunov exponent (MLE) values in all marker-sets, during running. Circles exhibit the individual values of the participants. *Statistically significant effect of marker position on the resulting MLE values (p < 0.05).
