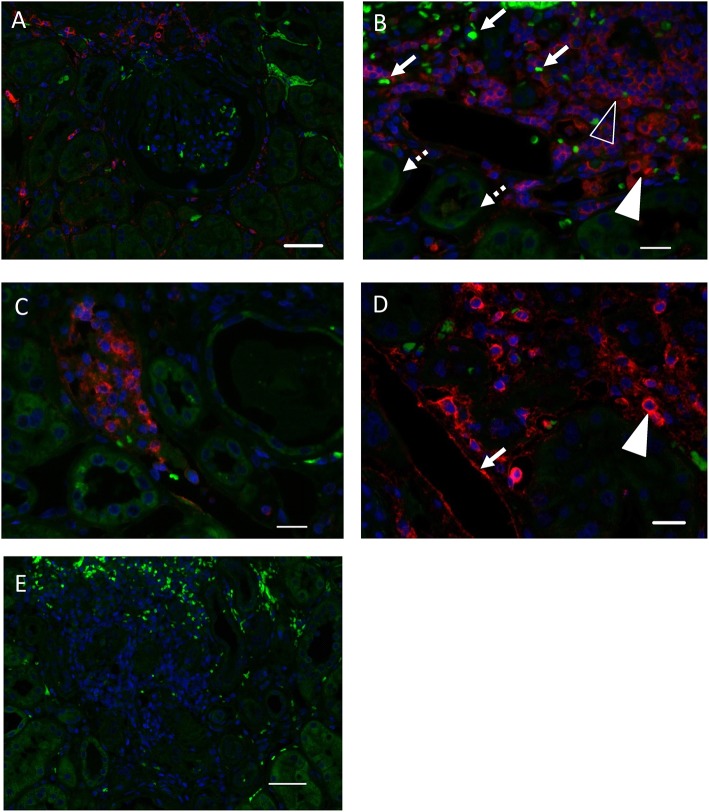
Figure 1.
ATLG binding within the kidney. (A) ATLG binding to kidney structures was detected via binding of anti-rabbit polymer and visualization by Opal570 (red). Autofluorescence of the tissue (green) was kept in order to visualize kidney tissue morphology. ATLG shows no binding to structures within the glomerulus. Original magnification ×200, scale bar = 50 μm. (B) ATLG binds to intravascular and extravasated leukocytes within the kidney. Leukocytes within vessels (filled arrowhead) as well as leukocytes migrated into the kidney (blank arrowhead) show binding of ATLG (red). Autofluorescence of the tissue (green) was kept in order to distinguish tissue structures and to visualize erythrocytes (arrow) and tubules (dotted arrow). Original magnification ×400, scale bar = 20 μm. (C) Abundant leukocytes within a peritubular capillary show ATLG binding (red). Autofluorescence (green) helps to distinguish erythrocytes and tubules. Original magnification ×400. (D) ATLG (red) binds to the wall of peritubular capillaries (arrow) and leukocytes (arrowheads) within the kidney. Original magnification ×400, scale bar = 20 μm. (E) No binding of ATLG was detected in saline perfused control kidneys. Picture was taken with the same exposure time as used for treated kidney tissue sections. Original magnification ×200, scale bar = 50 μm. Representative pictures of n = 2 experiments with different organs are shown.

