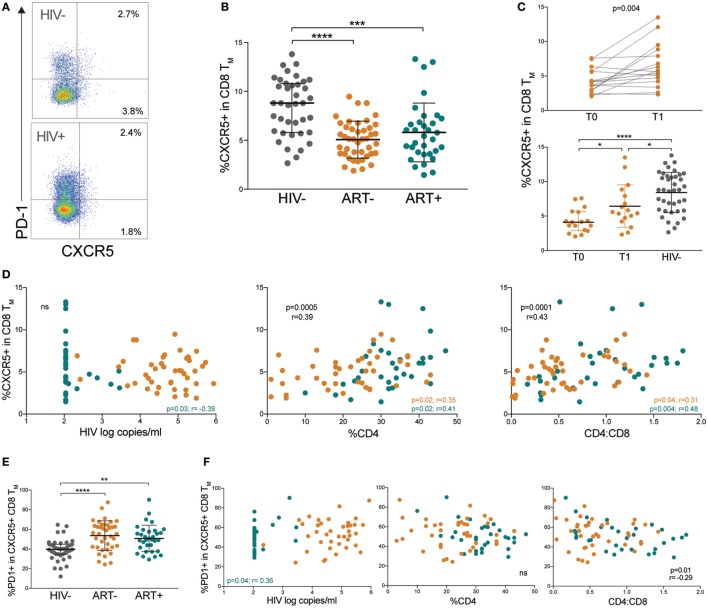
Figure 5.
HIV+ children have low CXCR5+ memory CD8 T cells with elevated programmed cell death protein 1 (PD-1). (A) FACS plots showing representative gating to identify memory pTfc cells as the total CXCR5+ population in memory CD8 T cells and PD-1 expression in an HIV− and HIV+ subject. Plots shown were gated within total memory CD8 T cells. (B) Comparison of CXCR5+ cells within total CD8+ memory T cells in HIV−, ART−, and ART+ children. (C) Prospective analysis of memory pTfc in ART− subjects before (T0) and ~12 months after antiretroviral treatment (T1). The second plot compares memory pTfc cell frequencies between ART− subjects at T0 and T1 and HIV− subjects. (D) Correlations between memory pTfc cell percentages and HIV log copies/mL, %CD4+ T cells, and CD4:CD8 ratios in HIV+ children (ART− in orange and ART+ in blue). (E) PD-1 expression on memory pTfc cells in HIV−, ART−, and ART+ subjects. (F) Correlation between PD-1+ memory pTfc cell frequencies and HIV log copies/mL, %CD4+ T cells, and CD4:CD8 ratios in HIV+ children. Significant p values are shown for statistical analysis of HIV+ (black), ART− (orange), and ART+ (blue) groups (****p < 0.0001, ***p < 0.001, **p < 0.01, and *p < 0.05).

