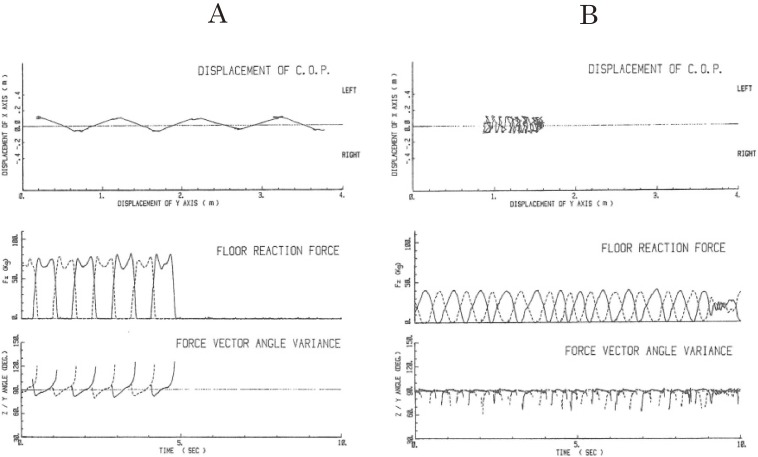
Figure 15.
Gait studies with floor reaction forces. A: sample records of floor reaction force studies in normal walking. Upper records: displacement of the center of pressure in a 4 m walk. Middle records: vertical component of floor reaction forces. The solid line shows the trace of pressure for the right foot and the dotted line for the left. Two peaks of vertical pressure at the beginning and the end of the step phase correspond to the step-in and kick-off forces. Duration of the complete shift of body weight to the foot on stepping is shown by zero pressure on the other foot. Lower records: z/y force vectors showing periodic step-in (below 90°) and kick-off (above 90°) forces. B: traces of locomotion and floor reaction forces in shuffling and frozen gait in a patient with Parkinson’s disease. Upper records: displacement of the center of pressure shows a shuffling gait with little forward movement in most of the record and cessation of locomotion at around the end as shown by dark tracings. Middle records: in a shuffling gait, both vertical pressure on stepping and zero phase in swing phases showed narrow single peaks at frequencies higher than normal. In freezing with no progression, which is shown in the last part of the record, the range of foot pressure became smaller and complete shifts of body weight on one foot were no longer observed. Lower records: z/y force vector showing frequent step-in forces but kick-off power was hardly observed even during shuffling gait. (From Yanagisawa, Ueno and Takami, 199146)).

