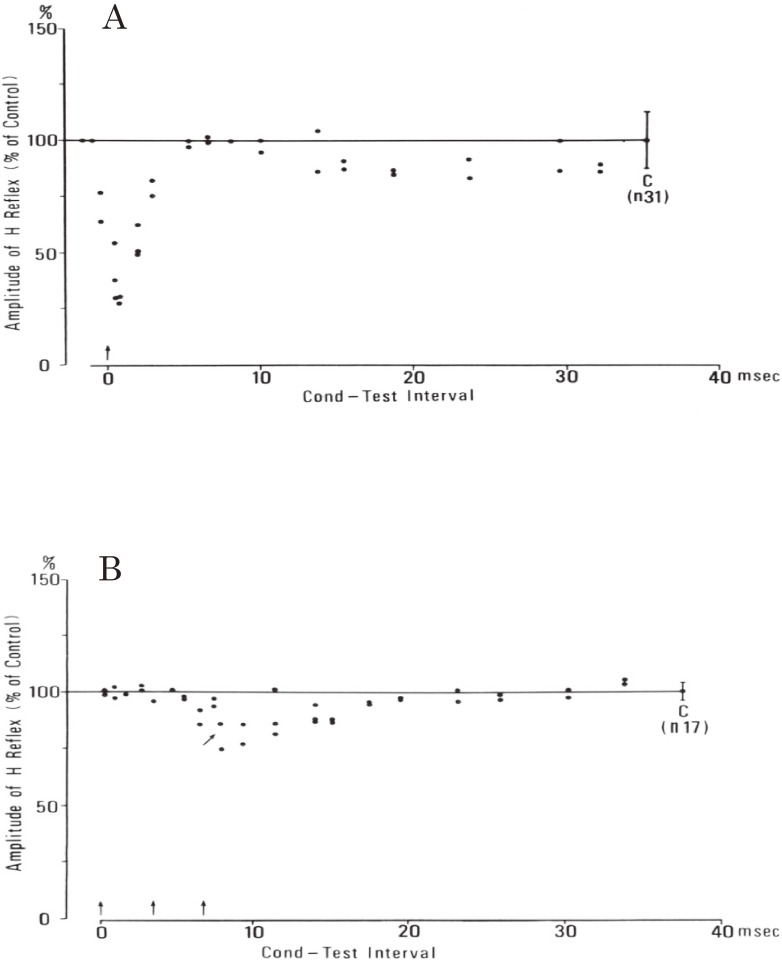
Figure 22.
Reciprocal Ia inhibition in spastic hemiplegia. In both A and B, the ordinate shows the amplitude of the test H reflex expressed as a percentage of the control amplitude (at C with standard deviation). The abscissa shows the time interval between the first conditioning and the test stimuli. Conditioning stimuli are indicated by arrows. A: from extensor (tibial) nerve to flexor (pretibial muscle) H reflex. Single conditioning stimulus with a strength of 0.75 XMT produced marked inhibition with short latency, which is attributable to Ia inhibition. B: from flexor (peroneal) nerve to extensor (triceps surae) H reflex. The inhibitory effect was very weak compared with A. Three peroneal stimuli at 1.56 XMT, 300 Hz produced slight inhibition from 8.0 msec (arrow). (From Yanagisawa, Tanaka and Ito, 197670)).

