Figure 5.

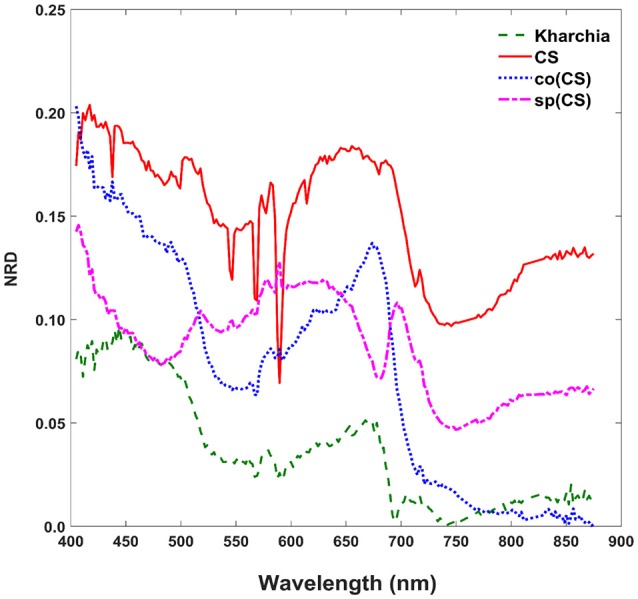
Normalized reflectance difference (NRD) of wheat lines, indicating how much the averaged reflectance of the salt pixels changed compared to the control pixels in response to the imposed salt stress on each wheat line.

Normalized reflectance difference (NRD) of wheat lines, indicating how much the averaged reflectance of the salt pixels changed compared to the control pixels in response to the imposed salt stress on each wheat line.