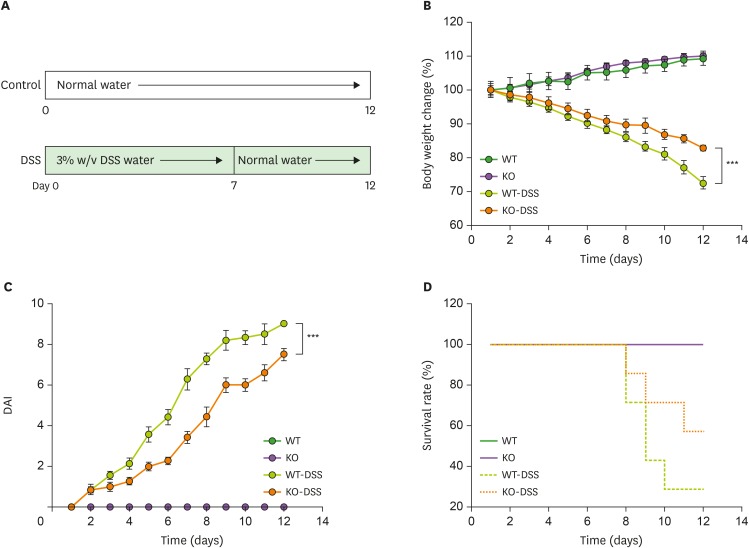
Figure 1. Clinical activity was attenuated in a DSS-induced colitis STAT3 KO mouse model. (A) Experimental design for DSS-induced colitis. (B) Graph showing body weight changes in control and DSS-treated WT and KO mice (n=7 mice, group×time interaction: p=0.2394, group effect: p<0.001, time effect: p<0.001; 2-way ANOVA with Bonferroni correction). (C) Graph showing the DAI of control and DSS-treated WT and KO mice (n=7 mice, group×time interaction: p<0.001, group effect: p<0.001, time effect: p<0.001; 2-way ANOVA with Bonferroni correction). (D) Graph showing the survival rates of control and DSS-treated WT and KO mice (n=7 mice). Data are presented as the means±SEM.
***p<0.001.

