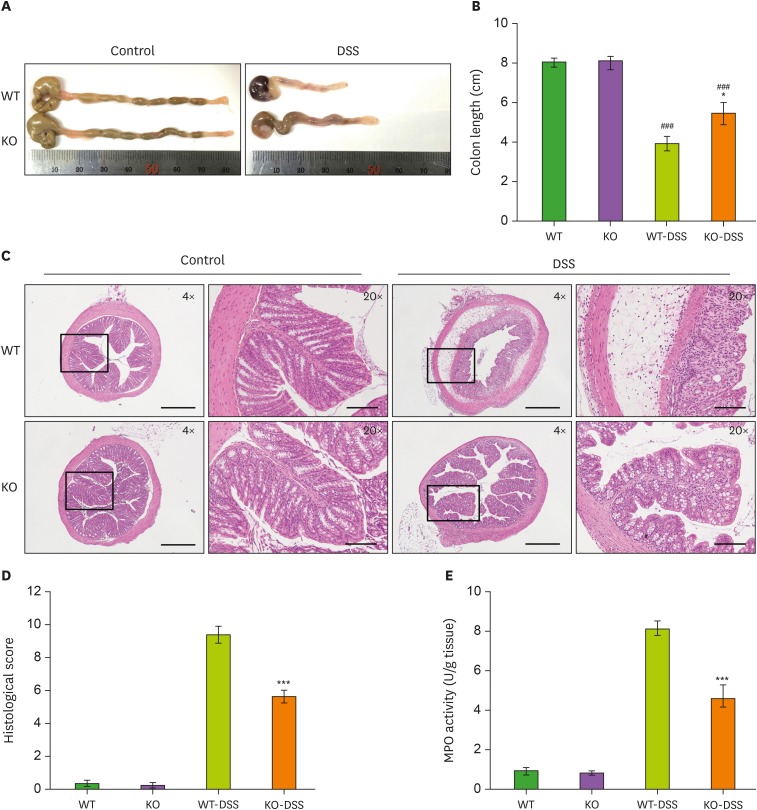
Figure 2. Deletion of STAT3 in T cells reduced histological scores and MPO activity in mice. (A) Representative images of colon tissues from control and DSS-treated WT and KO mice. (B) Bar graph for the colon lengths in control and DSS-treated WT and KO mice (n=7 mice). (C) Representative images of colon slices from control and DSS-treated WT and KO mice (scale bars: 4× image=500 μm; 20× image=100 μm). (D) Bar graph for the histological scores of control and DSS-treated WT and KO mice (n=7 mice). (E) Bar graph for the MPO activity in control and DSS-treated WT and KO mice (n=7 mice). Data are presented as the means±SEM.
*p<0.05, ***p<0.001 compared with the DSS-treated group; ###p<0.001.

