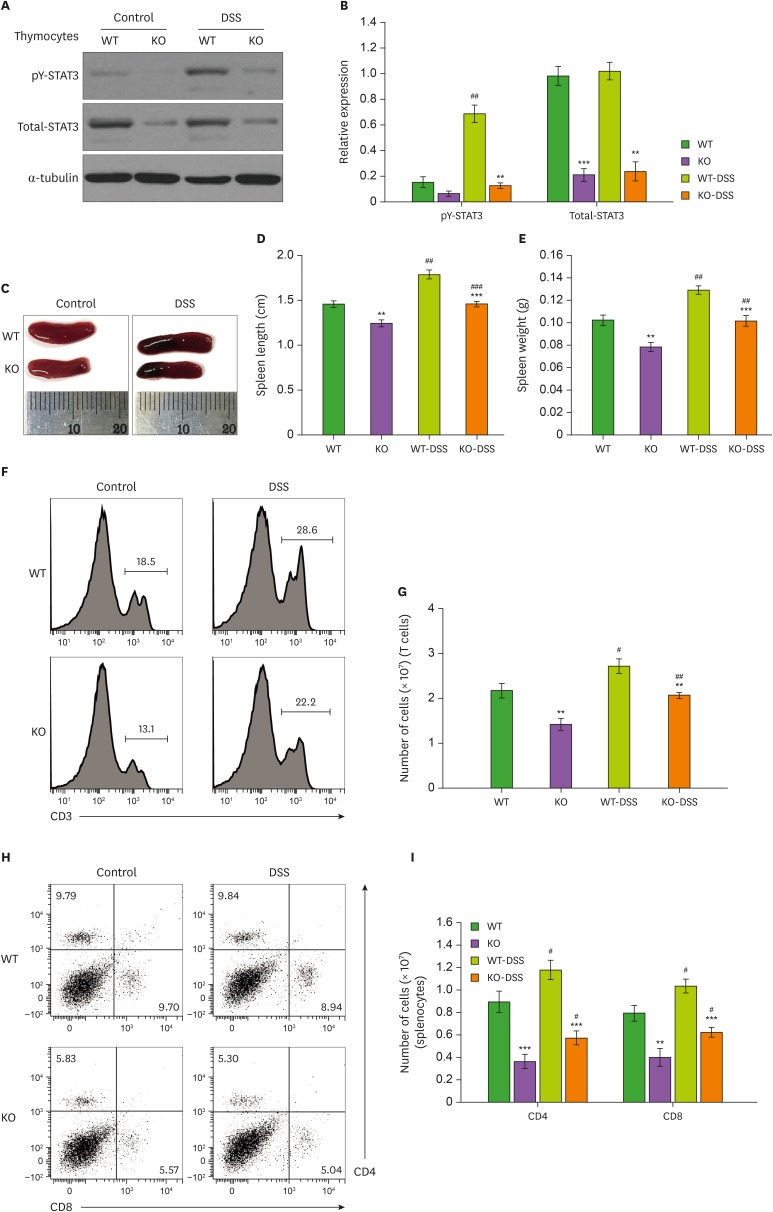
Figure 3. Changes in the T lymphocyte population in spleen of T cell-specific STAT3 KO mice. (A) Western blot analysis of pY-STAT3, total-STAT3, and α-tubulin in thymocytes from control and DSS-treated WT and KO mice. (B) Graph for the quantification of Western blot data (n=3 mice). (C) Representative images of spleen tissues from control and DSS-treated WT and KO mice. (D) Bar graph for the spleen lengths in control and DSS-treated WT and KO mice (n=7 mice). (E) Bar graph for the spleen weights in control and DSS-treated WT and KO mice (n=7 mice). (F) Representative flow cytometry analysis traces of splenocytes showing the distribution of CD3-positive T cells. (G) Bar graph for the numbers of T cells in control and DSS-treated WT and KO mice (n=5 mice). (H) Representative FACS plot of splenocytes showing the distribution of CD4- and CD8-positive T cells. (I) Bar graph for the numbers of CD4- and CD8-positive T cells in control and DSS-treated WT and KO mice (n=5 mice). Quantification of Western blot data was completed with relative densitometry and normalization to the level of α-tubulin. Data are presented as the means±SEM. Representative data from 3 independent experiments are shown.
**p<0.01, ***p<0.001 compared with the DSS-treated group; #p<0.05, ##p<0.01, ###p<0.001.

