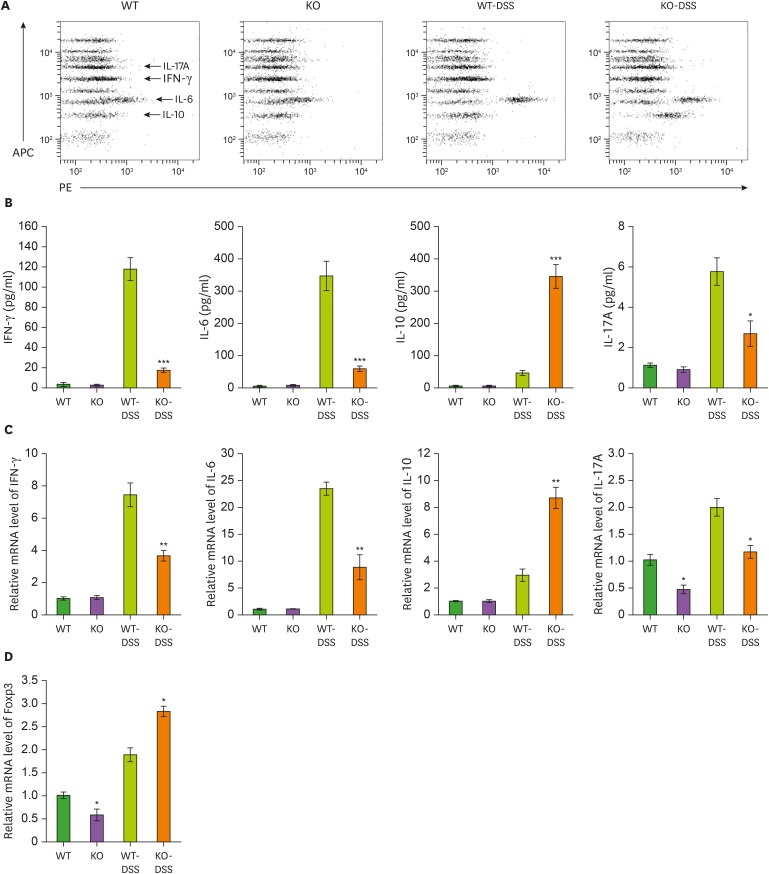
Figure 5. T cell-specific STAT3 deficiency affects the production of inflammatory cytokines. (A) Representative FACS plot of a multiplex bead-based immunoassay showing the distribution of cytokine production. (B) Bar graphs for the amounts of IFN-γ, IL-6, IL-10, and IL-17A in the serum from control and DSS-treated WT and KO mice (n=5). (C, D) Bar graphs for the mRNA levels of IFN-γ, IL-6, IL-10, IL-17A, and Foxp3 in colon tissues from control and DSS-treated WT and KO mice (n=5). Relative mRNA levels were normalized to those of GAPDH. Data are presented as the means±SEM. Representative data from 3 independent experiments are shown.
*p<0.05, **p<0.01, ***p<0.001.

