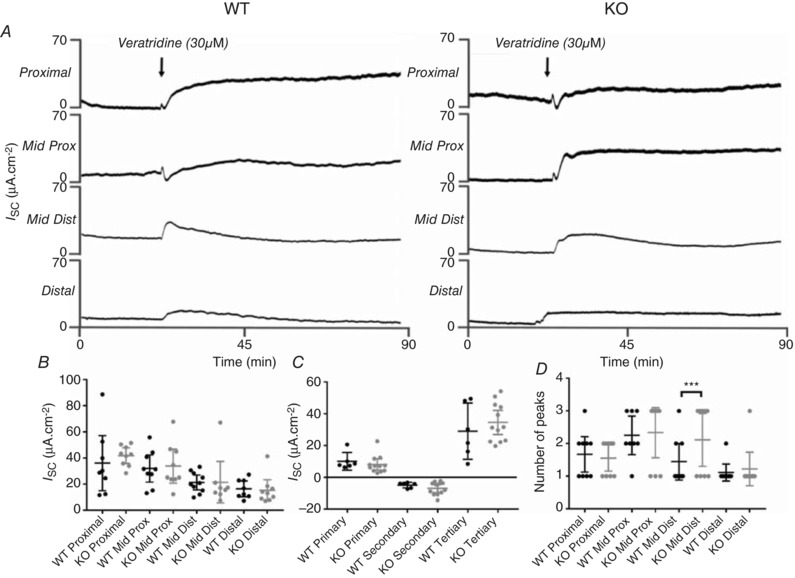
Figure 4. Colonic mucosal ion transport responses in WT and TNX‐KO mice.

Representative traces showing responses to veratridine in designated colonic tissues from WT vs. TNX‐KO mice (A). At 20 min veratridine was added and changes in I Sc were recorded for 90 min. No difference in veratridine‐induced responses was seen in the colonic regions of WT and TNX‐KO mice (B). Overall colonic response to veratridine also showed no change at initial peak (over 1 min, i.e. primary), second dip (within 2 min, i.e. secondary) or tertiary peak (10 min) (C). The number of mice with triphasic (i.e. an initial peak, followed by a drop below baseline followed by an overall increase in secretion) responses to veratridine was significantly increased in KO colon compared to WT in the mid‐distal colon (P = 0.0194) (D) (n = 11 WT vs. n = 9 KO). Data are shown as individual values with standard deviation. Statistical analysis was performed using an unpaired Student's t test for each region (P < 0.05).
