
Figure 4. Simulated movement of pre‐M1 helices is not strongly correlated across subunits.
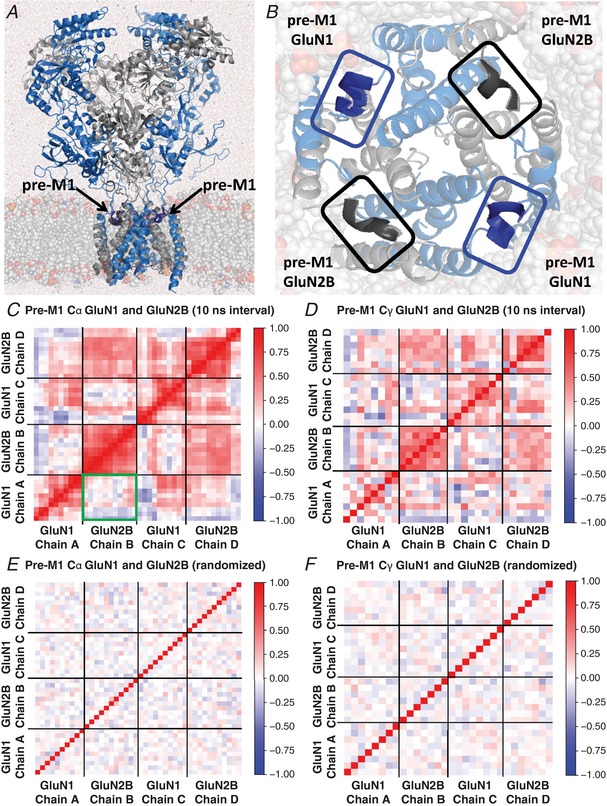
A, the hydrated GluN1/GluN2B (blue/grey) receptor was embedded in a lipid bilayer. B, the pre‐M1 linker regions are expanded with the transmembrane region and the membrane (translucent). C, heatmap of the dynamic cross‐correlation between the Cα atoms from each of 10 residues in the pre‐M1 of GluN1 (residues 551–560) and 11 residues in the pre‐M1 of GluN2B (residues 547–557) for chains A–D (chains labelled clockwise from top left) was determined from the first 500 ns of a 1 μs molecular dynamics run; identical results were obtained when analysing the full run (not shown). The section in the green box highlights a lack of correlation between pre‐M1 helices of adjacent subunits. D, the cross‐correlation of the Cγ atoms for 8 residues from the pre‐M1 of GluN1 and 7 residues from the pre‐M1 of GluN2B for chains A–D is shown. The red boxes forming a diagonal line indicate a perfect correlation of either the Cα or Cγ atoms of the pre‐M1 for both the GluN1 and the GluN2B chains to themselves. Only weak inverse correlation is observed with the correlation coefficient r ranging between 0 and 0.57; weak inverse correlations for subunits on opposite sides of the receptor are shown as red due to the rotation of the subunits to overcome orthogonality to the adjacent chains as described in the Methods. The cross‐correlation measurements shown at time intervals of 10 ns throughout the 500 ns simulation were consistent with those in the other time intervals. E and F, heatmaps were generated by shuffling the frames from the molecular dynamics trajectories shown in C and D to depict the absence of correlation that would be observed for completely random motion of the helices using 10 ns intervals for each Cα and Cγ, respectively. Cross correlations were determined as described in the Methods.