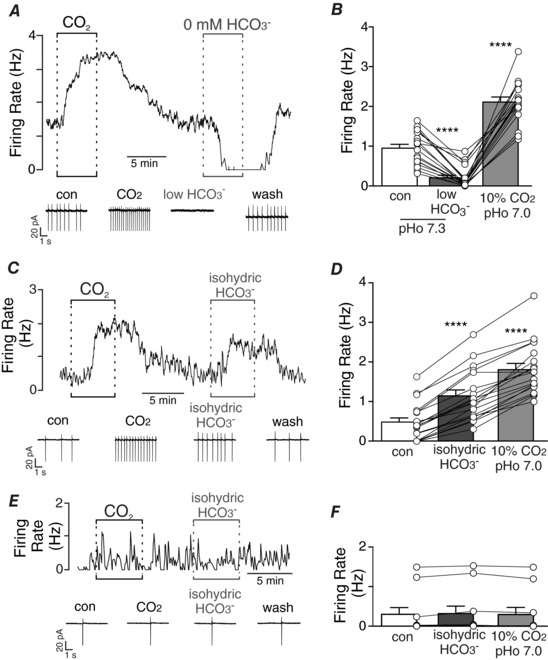
Figure 1. HCO3 −‐dependent modulation of chemosensitive RTN neurons.

A, trace of firing rate and segments of holding current shows a typical response of an RTN neuron in a slice incubated in normal Ringer's solution containing 26 mM HCO3 − to an increase in CO2 from 5% to 10%. After returning to control conditions, exposure to HCO3 −‐free Hepes buffer (pH 7.3) strongly inhibited baseline activity. B, summary data (n = 18) show average firing rate under control conditions and during exposure to HCO3 −‐free Hepes buffer (pHo 7.3) and 10% CO2 (pHo 7.0). C, trace of firing rate and segments of holding current from a chemosensitive RTN neuron shows that exposure to isohydric HCO3 − (10% CO2/52 mM HCO3 −) caused a robust increase in activity. D, summary data (n = 19) show average firing rate of chemosensitive RTN neurons under control conditions and during exposure to isohydric HCO3 − and 10% CO2 (pHo 7.0). E, trace of firing rate and segments of holding current from a CO2/H+‐insensitive RTN neuron shows that exposure to isohydric HCO3 − (10% CO2/52 mM HCO3 −) minimally affected firing behaviour. F, summary data (n = 10) show average firing activity of CO2/H+‐insensitive RTN neurons under control conditions and during exposure to isohydric HCO3 − and 10% CO2 (pHo 7.0). One‐way ANOVA with Tukey multiple comparison test. **** P < 0.0001. [Color figure can be viewed at http://wileyonlinelibrary.com]
