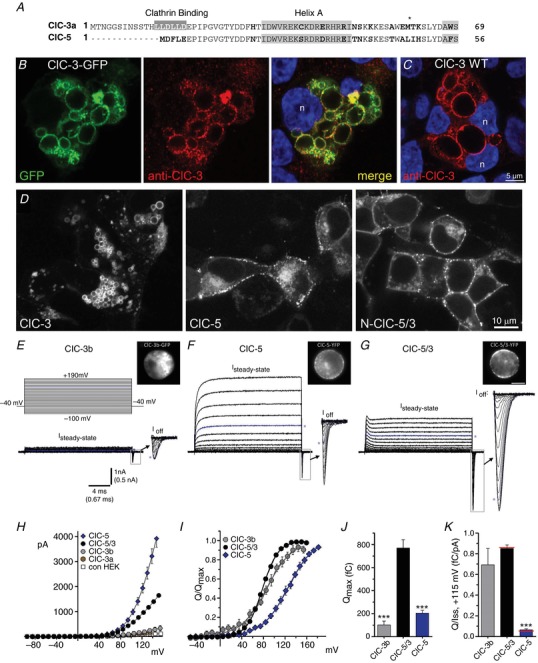
Figure 1. Functional expression and ion transport features of ClC‐5/3 compared to ClC‐3 and ClC‐5.

A, alignment of N‐terminal amino acid sequences of wild‐type ClC‐3a (“short” ClC‐3; top) and ClC‐5 transporters. Non‐conserved residues are indicated in bold. The clathrin binding sequence (LLDLLD, shaded) promotes ClC‐3a removal from the plasma membrane. B, HEK 293T cells transfected with wild‐type ClC‐3a‐GFP fusion construct (GFP, left) are stained with anti‐ClC‐3 (red, centre). DAPI co‐staining (blue, right) shows individual cell nuclei (n). ClC‐3‐GFP localizes strongly to abnormally large cytoplasmic vesicles, and co‐localizes with anti‐GFP vesicular labelling (merged panel, right). C, cells transfected with wild‐type (WT) non‐fusion ClC‐3a and co‐stained with anti‐ClC‐3 (red) and DAPI (blue) exhibit a similar pattern of protein localization to enlarged vesicles, confirming that the C‐terminus GFP tag does not cause the vesicle phenotype or alter ClC‐3 trafficking. D, typical YFP‐fusion protein expression patterns and vesicular morphology in cells transfected with wild‐type ClC‐3a (left), wild‐type ClC‐5 (centre), and the ClC‐5/3 chimera (right). ClC‐3a localizes primarily to enlarged vesicles, with little detectable plasma membrane localization. ClC‐3b overexpression features are entirely similar (not shown). In contrast, ClC‐5 and ClC‐5/3 show similar localization to both the plasma membrane and vesicular compartments. E–G, leak‐subtracted whole‐cell ion currents recorded from cells expressing wild‐type ClC‐3b (E), ClC‐5 (F) and ClC‐5/3 (G). Images show GFP‐ and YFP‐fusion protein expression and distribution in the recorded cells. Voltage protocol is depicted in E (top) (−40 mV V H; 20 ms test pulses ranging from −100 to +190 mV). Steady‐state (I SS) and transient Off‐gating current components are illustrated; “I Off” transients (boxed regions) are shown at magnified scale (arrows) at right. Currents are displayed up to maximum depolarizations of +160 mV, except for ClC‐5 I Off (+180 mV maximum). Asterisks (blue traces) indicate currents recorded at +120 mV applied potential. ClC‐5/3 is distinguished by larger and more prolonged gating currents compared to ClC‐5. ClC‐3a‐expressing cells did not exhibit significant I SS or transients. H, mean I SS (pA)–V relationships for ClC‐5, ClC‐5/3, ClC‐3a, ClC‐3b and non‐transfected HEK controls. I, normalized Off‐transient gating charge (Q/Q max) plotted vs. test pulse voltage for ClC‐3b, ClC‐5/3 and ClC‐5. Continuous lines show fits to Boltzmann functions. J, quantified Q max measured for the three genotypes (*** P < 0.0005 vs. ClC‐5/3, one‐way ANOVA). K, ratio of Q Off to transport current (Q/I SS, +115 mV; fC/pA) for the three genotypes (*** P < 0.0005 vs. ClC‐5/3, one‐way ANOVA). Red lines indicate mean ratios after correction of Q and I values to a corrected voltage of +115 mV. [Color figure can be viewed at http://wileyonlinelibrary.com]
