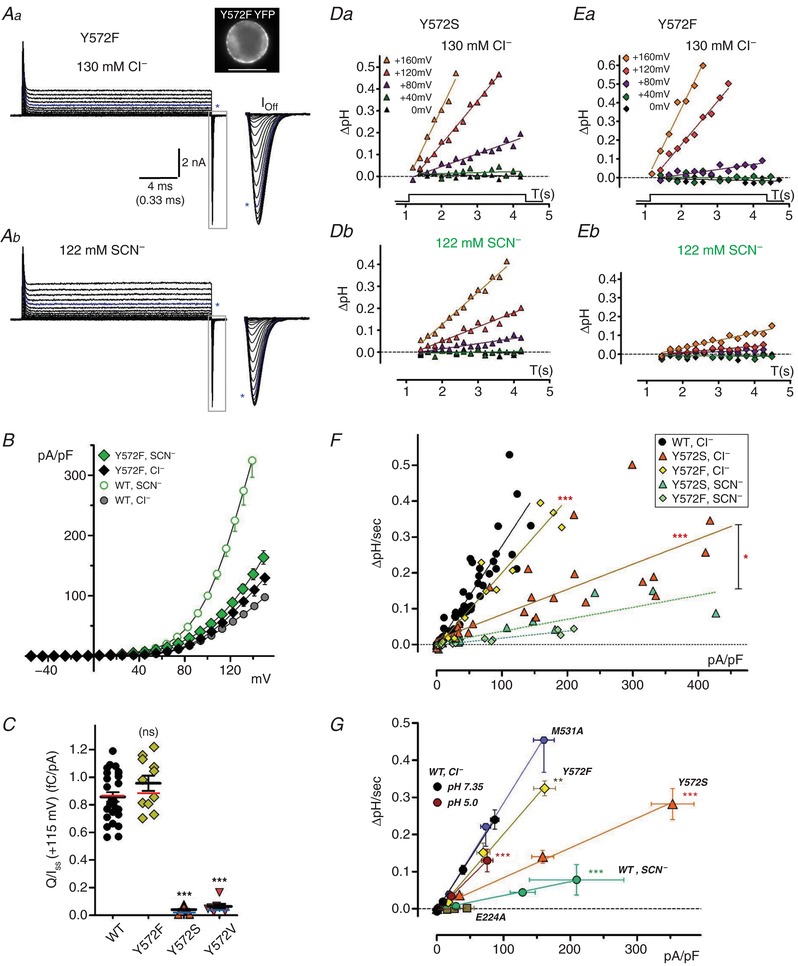
Figure 7. Y572F mutation alters anion transport and H+ coupling.

A, Y572F transport and gating currents in Cl−‐ (a) and SCN−‐containing external saline (b). Image at top right shows Y572F‐YFP expression in the recorded cell. Steady‐state (I SS) currents are displayed to a voltage of +160 mV; Off‐gating transients (boxed regions, expanded at right) are displayed to a voltage of +180 mV. Asterisks indicate traces at +115 mV. Y572F results in large, rapid gating currents. B, quantified Y572F I SS–V relationships (n = 10). Y572F I SS is slightly larger than wild‐type (circles) in Cl−, but Y572 current undergoes little increase in SCN− compared to wild‐type. C, Q/I SS ratios (fC/pA, +115 mV) compared for wild‐type and Y572 mutants (Y572F, Y572S, Y572V). Coloured lines overlaid on plots indicate mean ratios after correction of Q and I values to a corrected voltage of +115 mV. Q/I SS is unaltered in Y572F, but greatly decreased in Y572S and Y572V (*** P < 0.0001). D and E, pH changes recorded during depolarizing pulses in BCECF‐loaded Y572S‐ (D) and Y572F‐expressing cells (E). Y572S exhibits robust H+ transport rates (ΔpH/s) in external Cl− (Da) and slowed rates in external SCN− (Db; same‐cell recording). Y572F (E) likewise exhibits robust H+ transport in Cl− (Ea), and markedly slower transport in external SCN− (Eb, same‐cell recording). Continuous lines are fitted to the data by linear regression. F, rates of pH change (ΔpH/s) plotted vs. corresponding current densities (pA/pF) for Y572S and Y572F, compared to wild‐type (filled circles). Data for each genotype are fitted by linear regression (lines). Y572S slope in Cl− is reduced to ∼25% of wild‐type (*** P < 0.0001, n = 8; see also Table 2), and further reduced in external SCN− (** P = 0.011 vs. Cl−, n = 3). Y572F slope in Cl− is significantly reduced compared to WT (*** P < 0.0001; n = 4), indicating an increased exchange ratio of ∼2.7:1, while H+ transport is nearly eliminated in SCN−. G, relationships between rate of pH change (DpH/sec) and mean current density (pA/pF) are summarized for ClC‐5/3 wild type (WT; pH 7.35 and pH 5.0 in external Cl−, and pH 7.35 in external SCN− ) and mutant genotypes (external Cl−, pH 7.35). Symbols show mean values (± S.E.M.) recorded at each applied potential level (0, +40, +80, +120 and +160 mV). Solid lines are fit to each data group by linear regression. Asterisks denote significantly reduced slope (** P<.001; *** P<0.0001) compared to WT in control saline (pH 7.35, external Cl−). [Color figure can be viewed at http://wileyonlinelibrary.com]
