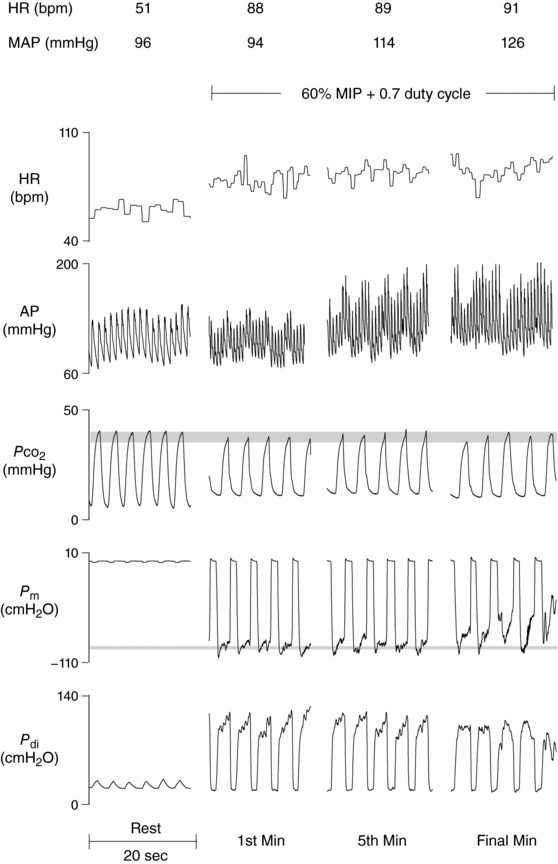
Figure 6. Raw traces of cardiorespiratory variables from one representative subject during pressure‐threshold loading.

A time‐dependent increase in HR and MAP was observed. Isocapnia was maintained throughout as shown by end‐tidal Approximate square‐wave pressure generation was achieved until the final minute of loading. AP, arterial pressure; HR, heart rate; , partial pressure of CO2; P di, transdiaphragmatic pressure; P m, mouth pressure.
