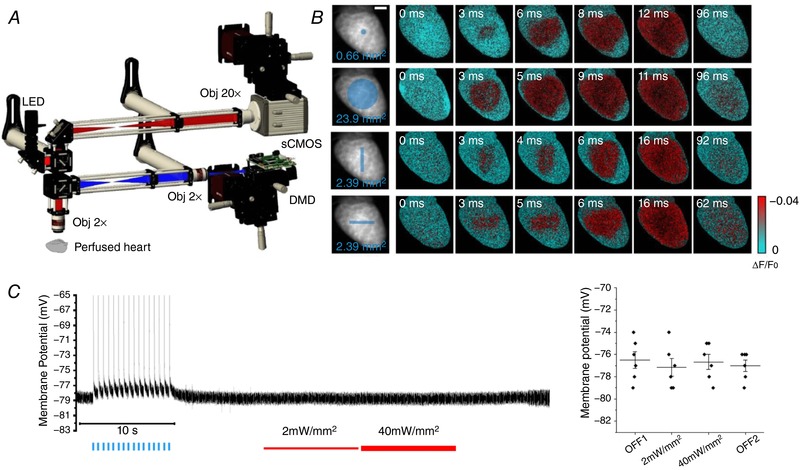
Figure 1. Targeted optogenetic manipulation of cardiac conduction.

A, scheme of the wide‐field fluorescence mesoscope. A red LED followed by a band‐pass filter (640/40 nm) excites through a ×2 objective the whole mouse heart, stained with a red‐shifted electro‐chromic voltage‐sensitive dye (Di‐4‐ANBDQPQ). A dichroic beam splitter followed by a band‐pass filter (775/140 nm) is used for collecting the emitted fluorescence signal. A 4f system is adopted to collimate the beam onto a ×20 objective. The signal is then focused into a central portion (128 × 128 pixels) of a sCMOS sensor operating at a frame rate of 1.6 kHz (630 μs actual exposure time). A commercial light steering solution based on a digital micro‐mirror device (DMD) was coupled with the mesoscope using a high numerical aperture relay system and a dichroic beam splitter. B, optical mapping during four patterns of optogenetic stimulation: single‐point, whole ventricle, vertical line and horizontal line, designed as reported by the blue traits on the fluorescence image (F 0) of the heart. Six representative frames of optical mapping (∆F/F 0) showing the electrical activation in red and the baseline in cyan. All stimulations were performed with a light intensity on the sample of 4 mW mm−2 and 2 ms exposure time. Scale bar: 2 mm. C, on the left, a representative trace of membrane potential recorded in cardiomyocytes isolated from ChR2 heart using patch clamp. At the beginning of the recording (OFF1), the optogenetic excitability of the cell was confirmed inducing sixteen action potentials using blue light pulses (blue lines). In the remainder of the recording, the red LED used for VSD imaging was turned on with two different power intensities (2 mW mm−2, thin red line and 40 mW mm−2, thick red line) and turned off again (OFF2) showing no variation in resting membrane potential. On the right, graph shows resting membrane potential during different states of red LED illumination. Each data point (black circle) represents the average of membrane resting potential of a different cell. Also indicated is the mean and the standard error of the mean of each illumination state. No statistically significant differences (ANOVA; number of mice, 2; number of cells, 6) were found between categories.
