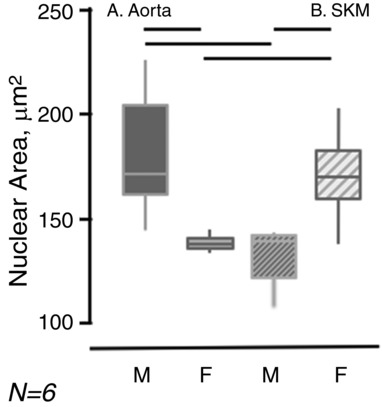
Figure 4. Differences in EC nuclear size by sex and by origin.

The areas of confluent EC nuclei, identified by DAPI staining, were determined in six sets of cell preparations. The data are represented by bar and whisker plots with the solid horizontal line being the median, the bar extending from the 25th to 50th percentile and the vertical lines extending from the 5th to 95th percentiles. The solid horizontal bars identify significant differences (P < 0.05).
