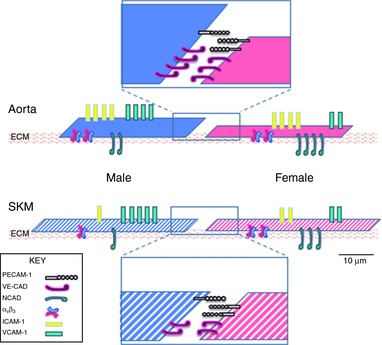
Figure 12. Cartoon of EC protein expression, size and thickness illustrating the influence of tissue origin and sex on EC phenotype.

Solid colours indicate the macrovascular EC and striped colours indicate the microvascular EC. Solid blue indicates male aortic EC; solid magenta indicates female aortic EC; striped blue indicates male SKM EC; and striped magenta indicates female SKM EC. Cells are drawn to illustrate the calculated length of one side and cell depth in a simplistic model from Fig. 10. Using the relative expression heat maps from Figs 8 and 9, rough approximations of whole number protein expression were made. Cell junctions were enlarged to view junctional proteins. Scale bar = 10 μm.
