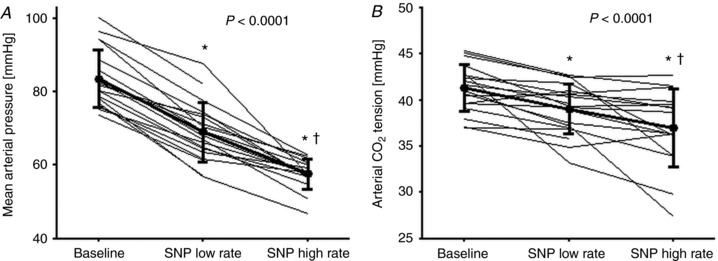
Figure 1.

Mean arterial pressure and arterial CO2 tension at baseline and during infusion of sodium nitroprusside (SNP)
A and B, mean arterial pressure (A) and arterial CO2 tension (B) at baseline (n = 19) and during low (n = 19) and high (n = 16) SNP infusion rate. Values are individual data and means ± SD. P values represent the overall effect as estimated by a repeated measure mixed model. * P < 0.05 vs. baseline. † P < 0.05 for low vs. high SNP infusion rate.
