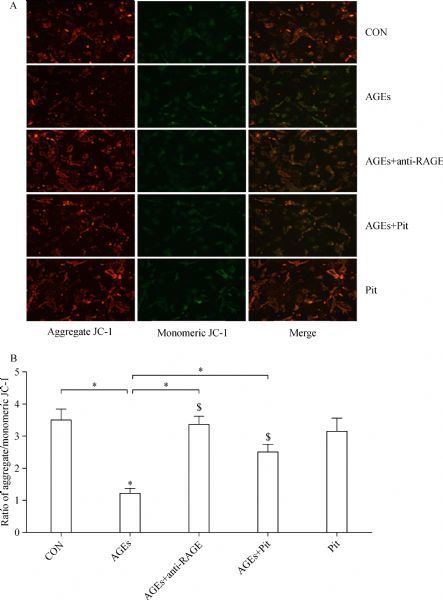
Fig.2.

The effect of pitavastatin on AGEs-induced mitochondrial membrane potential (ΔΨm). Mitochondrial membrane potential was evaluated using JC-1 dye. Green fluorescence indicates low mitochondrial membrane potential, and red fluorescence indicates high mitochondrial membrane potential. (A) Fluorescence microscopy and (B) quantitative measurements of the fluorescence intensity uncovered alteration of intracellular mitochondrial membrane potential. Red-orange fluorescence came from JC-1 aggregates and green fluorescence came from JC-1 monomers. ΔΨm was assessed by JC-1 aggregates/JC-1 monomers ratios. Data are presented as mean±SD (n = 3 in each group). *P < 0.01; n = 3 in each group.
