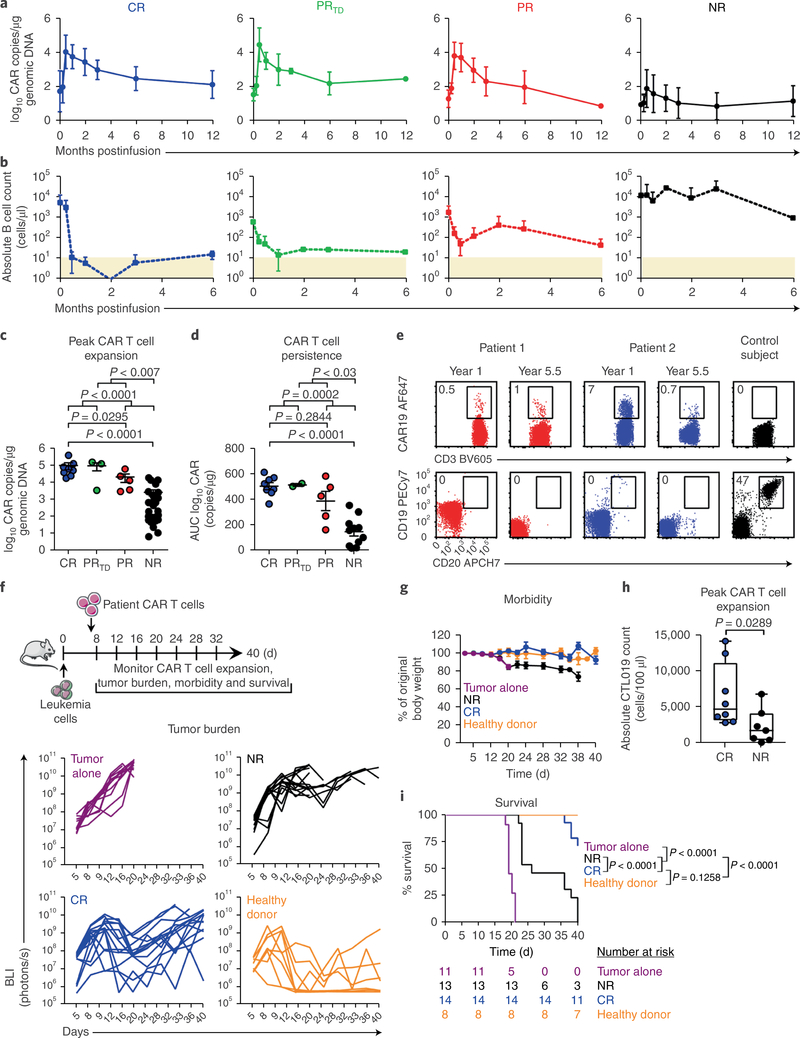
Fig. 1|. The intrinsic potency of CAR T cells from patients with CLL drives response to therapy.
a, Expansion kinetics of peripheral blood CTL019 cells from patients with CLL. b, Peripheral blood B cell counts from matched patients. In a and b, graphs show mean± s.d.; shaded areas, detection limit (CR, n = 8; PRTD, n = 3; PR, n = 5; NR, n = 25). c, Peak expansion of CTL019 cells (log10 copies per microgram genomic DNA). d, Persistence of CTL019 cells in evaluable patients, shown by AUC calculations (log10 copies per microgram genomic DNA from day 0 to maximum expansion time by day 180). In c and d, P values were calculated with two-tailed Mann-Whitney tests. Symbols, individual patients; bars, s.e.m. (CR, n = 8; PRTD, n = 2–3; PR, n = 5; NR, n = 25). e, Flow cytometric plots of peripheral blood CAR T cells (top) and B cells (bottom) in two CR patients at 1 and 5.5 years postinfusion, compared with a control ubject (representative of 2 independent experiments). f, Top, schema of CAR T cell transfer into leukemic mice. Bottom, longitudinal tumor burden (BLI) of CTL019-treated mice (each line represents one mouse). g, Longitudinal weight loss in mice. Data are shown as mean± s.e.m. (tumor alone, n = 11; NR, n = 13; CR, n = 14; healthy donor, n = 8 for f and g). h, Peak CAR T cell counts in mice treated with CR (n = 8) or NR (n = 7) patient T cells (each symbol indicates one animal; boxes extend from the twenty-fifth to seventy-fifth percentiles; middle line, median; whiskers, minimum and maximum). i, Kaplan-Meier analysis of survival. P values were determined with two-tailed log-rank Mantel-Cox tests. The numbers of animals at risk in each group at specific time intervals are listed below the survival curve.

