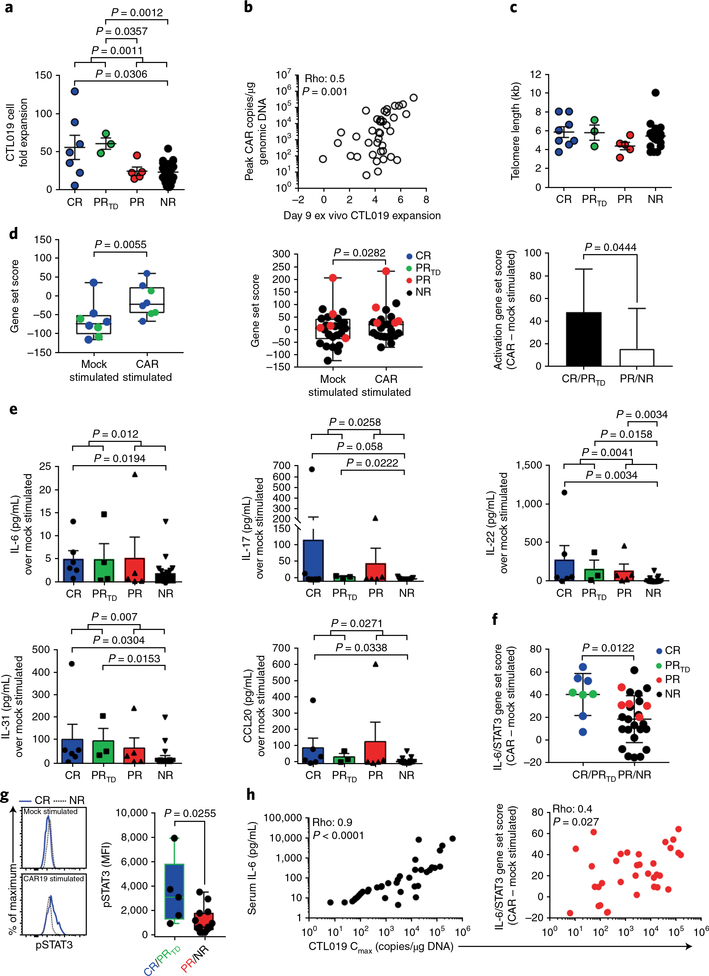
Fig. 3|. CAR T cell replicative capacity, activation potential and IL-6/STAT3-pathway enrichment define therapeutic response and failure.
a, Ex vivo proliferation of CTL019 cells during clinical manufacturing, stratified according to clinical response (CR, n = 7; PRTD, n = 3; PR, n = 5; NR, n = 25). P values were calculated with two-tailed Mann-Whitney tests. b, Spearman’s rho correlation (two-tailed) between the ex vivo expansion potential and maximum in vivo proliferative capacity (measured by the cellular population doubling number) of adoptively transferred CTL019 cells in matched patients with CLL (n = 40). c, Comparison of telomere lengths between bulk, preinfused CTL019 cells in responding and nonresponding patients (CR, n = 8; PRTD, n = 3; PR, n = 5; NR, n = 20). Graphs in a and c show mean ± s.e.m. d, Single-sample enrichment analysis of T cell-activation gene signatures in the CTL019 gene expression profiles from CR/PRTD patients (n = 8; left) and PR and NR subjects (n = 26; middle) who received mock or CAR-specific stimulation. The rightmost panel depicts the magnitude of change in a T cell activation-associated gene-set score from mock- to CAR-stimulated CTL019 preinfusion cells from patients belonging to the respective response categories. P values were calculated with two-tailed paired t tests. e, Levels of soluble cytokines produced from CAR-stimulated CTL019 cells subtracted from baseline levels; matched, unstimulated controls in evaluable patient samples were used (CR, n = 6; PRTD, n = 3; PR, n = 5; NR, n = 21). P values were calculated with two-tailed Mann-Whitney tests. Graphs show mean with s.e.m. overlaid; symbols represent individual patient samples. f, Single-sample gene set enrichment analysis of the IL-6/STAT3 pathway in CAR-stimulated CTL019 cells from patients in each response group (P values were determined with two-tailed Welch’s t tests). Bars represent the mean ± s.e.m. g, Representative flow cytometry showing levels of pSTAT3 in preinfusion CTL019 cells from a CR and NR patient after overnight stimulation with isotype-control antibody-coated beads (mock stimulated) or beads coated with an anti-idiotypic antibody against CAR19 (CAR19 stimulated) (left). Pooled data from patients with highly functional (CR, n = 3; PRTD, n = 2) versus poorly functional (PR, n = 3; NR, n = 11) CAR T cells are shown in box plots (right). Boxes indicate the twenty-fifth to seventy-fifth percentiles; middle line, median; whiskers, minimum and maximum. Each symbol denotes an individual patient sample. The change in fluorescence intensity (ΔΜΡΙ) was calculated by subtracting the MFI of pSTAT3 in stimulated cells from that in unstimulated cells. The P value was calculated with a two-tailed Mann-Whitney test. h, Spearman’s rho correlation (two-tailed) shown between the maximum in vivo proliferative capacity of adoptively transferred CAR T cells (Cmax) and peak levels of serum IL-6 (n = 41; left) or IL-6/STAT3 gene enrichment in patient-matched CAR-stimulated (as above) CTL019 cells (n = 34; right).

