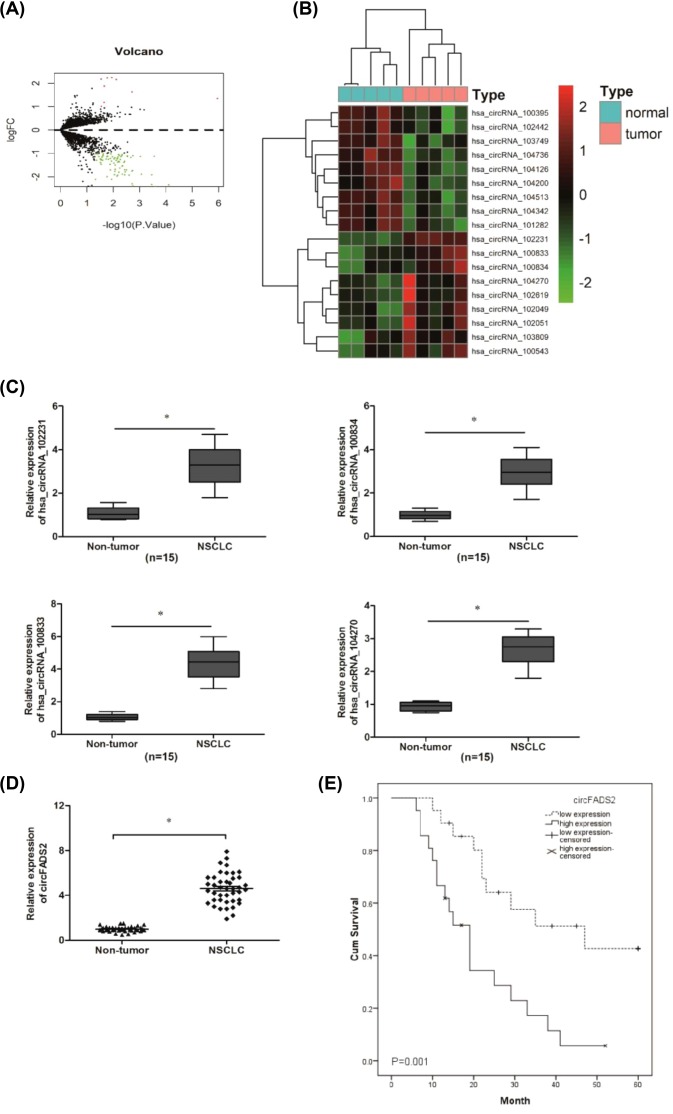
Figure 1. CircRNA expression profile in NSCLC tissues.
(A) Scatter-plot of circRNAs expression in NSCLC tissues and normal lung tissues. (B) Heat maps showed the top 9 up-regulated and down-regulated circRNAs in NSCLC tissues and normal lung tissues. (C) Expression of four indicated circRNAs listed in (B) were determined by qRT-PCR in 15 paired NSCLC tissues. (D) The expression of circFADS2 was detected by qRT-PCR in 43 paired NSCLC tissues. (E) Kaplan–Meier survival rate analysis based on circFADS2 expression in NSCLC patients; *P<0.05.

