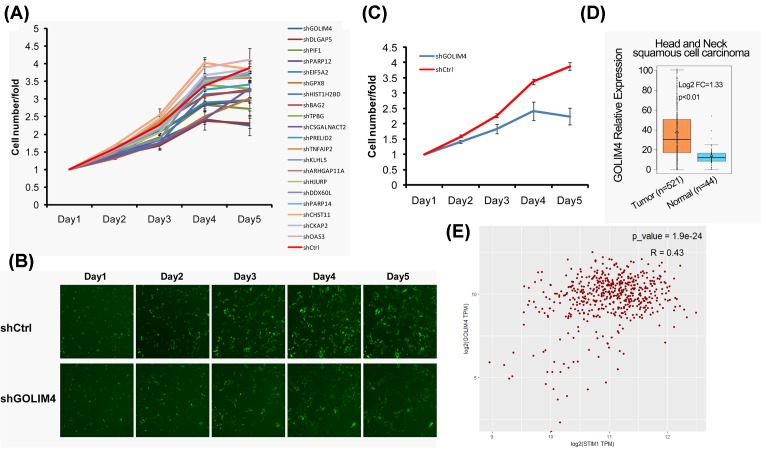
Figure 1. GOLIM4 is decreased when knocked down of STIM1.
(A) Cell proliferation was measured after knockdown of 20 candidate genes in FaDu cells. (B) The representative images of FaDu cells that infected with negative control lentivirus (shCtrl-EGFP) and shGOLIM4-EGFP lentivirus. Green fluorescence showed the viable cells. (C) The growth curves of the corresponding negative control group (shCtrl) and shGOLIM4 group in the FaDu cells as described in (A). (D) The expression of GOLIM4 in head and neck cancer tissues (n=521) and normal donors (n=44) from TCGA database. (E) The correlation analysis of GOLIM4 and STIM1 in head and neck cancer tissues from TCGA database. Pearson correlation coefficient was used, P<0.001, R = 0.43.

