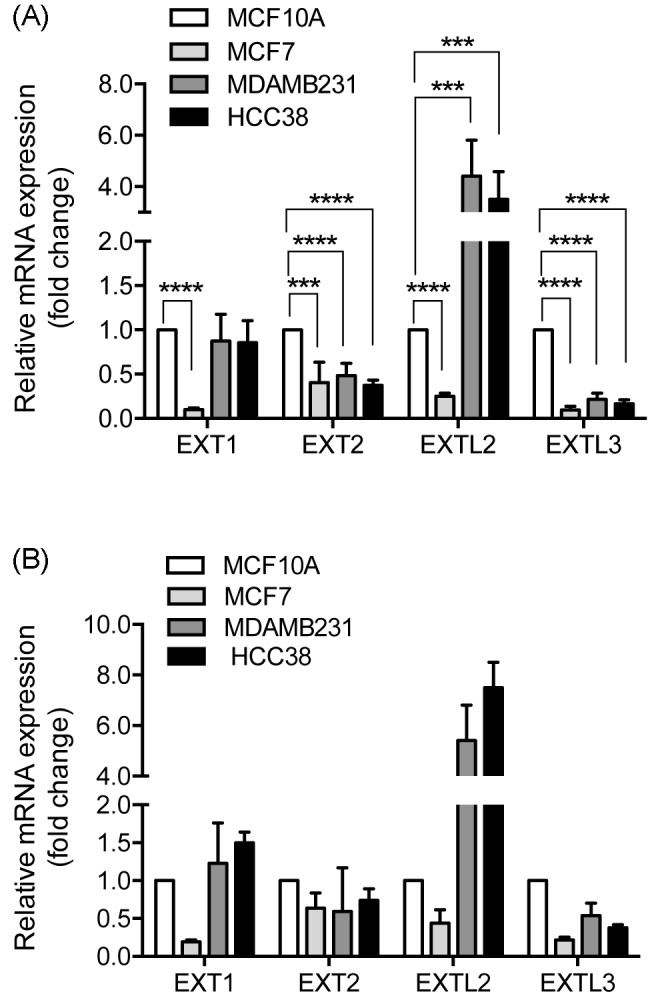
Figure 1. Expression levels of EXT gene family members.

Relative mRNA levels were determined by real-time PCR and normalized to (A) HPRT and (B) POLR2F. mRNA levels of MCF7, MDA-MB-231, and HCC38 were expressed relative to the non-tumorigenic MCF10A expression that was set to 1. The error bars in (A) represent the mean ± S.D. from three independent analyses performed in duplicate or triplicate. The error bars in (B) represent average values from two independent analyses performed in duplicate. EXTL1 was not detected in any of the analyzed cell lines: ***P<0.001; ****P<0.0001.
