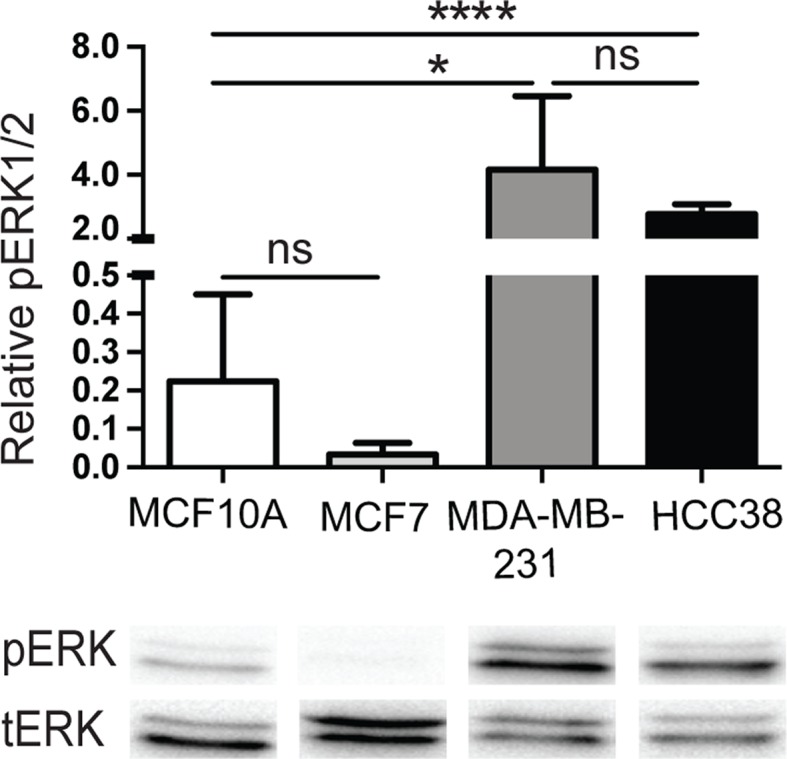
Figure 5. Mitogen-activated protein kinase (MAPK) activity.

MCF10A, MCF7, MDA-MB-231, and HCC38 cells were serum-starved for 20 h and then cells were lysed. Proteins were separated by SDS/PAGE followed by transfer to nitrocellulose membranes and immunoblotting with an antibody to the phosphorylated forms of ERK1/2 (pERK). After stripping off the nitrocellulose membranes, they were immunoblotted with the non-phosphorylated forms of ERK1/2 (tERK). Shown is one representative result. The histogram shows the quantitation of the ratio of pERK to tERK. The error bars represent the mean ± S.D. from four independent experiments: *P<0.05; ****P<0.0001. Abbreviation: ns, not significantly different.
