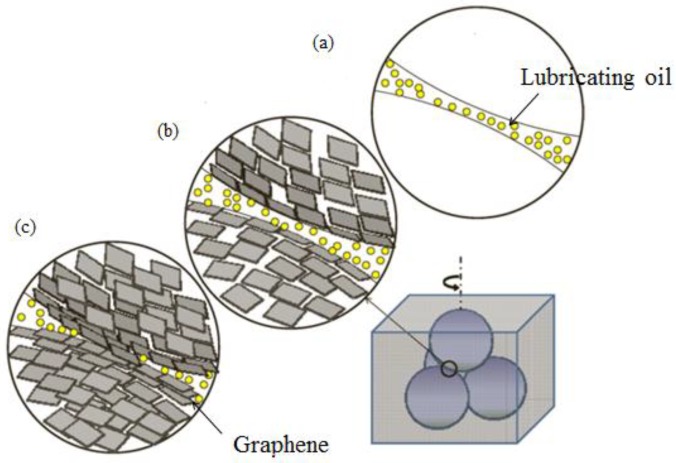
Figure 4.
Schematic of the four-ball friction test. (a) Friction diagram of pure lubricating oil. (b) Represents optimal concentration of graphene in oil. (c) Represents excessive concentration of graphene in oil. Reproduced with permission from reference Zhang et al. [83], Copyright 2011, IOP.

