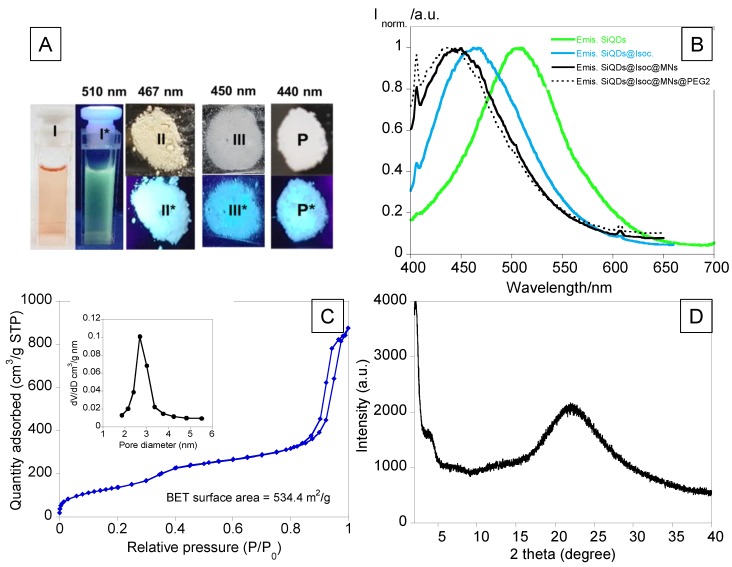
Figure 2.
(A) Naked-eye images (I, II, III, P) and under an emissive UV lamp (λexc=365 nm) (I*, II*, III*, P*) of SiQDs (I, I*), SiQDs@Isoc (II, II*), SiQDs@Isoc@MNs (III, III*), SiQDs@Isoc@MNs@PEG2 (P, P*). (B) Emission spectra of SiQDs and Solid-state emission spectra of SiQDs@Isoc, SiQDs@Isoc@MNs and SiQDs@Isoc@MNs@PEG2. (C) Nitrogen physio sorption isotherms and pore size distribution (inset). (D) X-ray diffraction (XRD) of SiQDs@Isoc@MNs.

