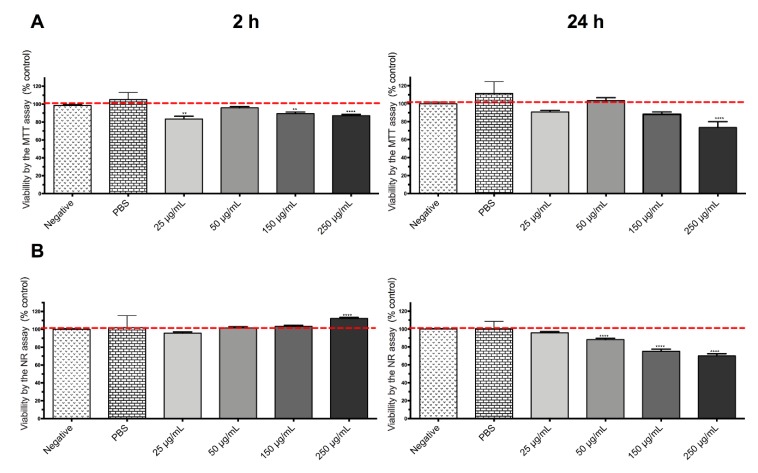
Figure 7.
MTT reduction assay (A) and NR incorporation assay (B) after 4 and 24 h incubations of DOX-loaded SiQDs@Isoc@MNs (25 μg/mL–250 μg/mL) for Caco-2 cell line. Results are expressed as mean ± SEM (n = 3 independent experiments). Data are presented as percentage of cell death relative to the respective negative control. Statistical comparisons were made using one-way ANOVA/Dunn’s multiple comparison test (** p < 0.01; **** p < 0.0001 vs. negative control).

