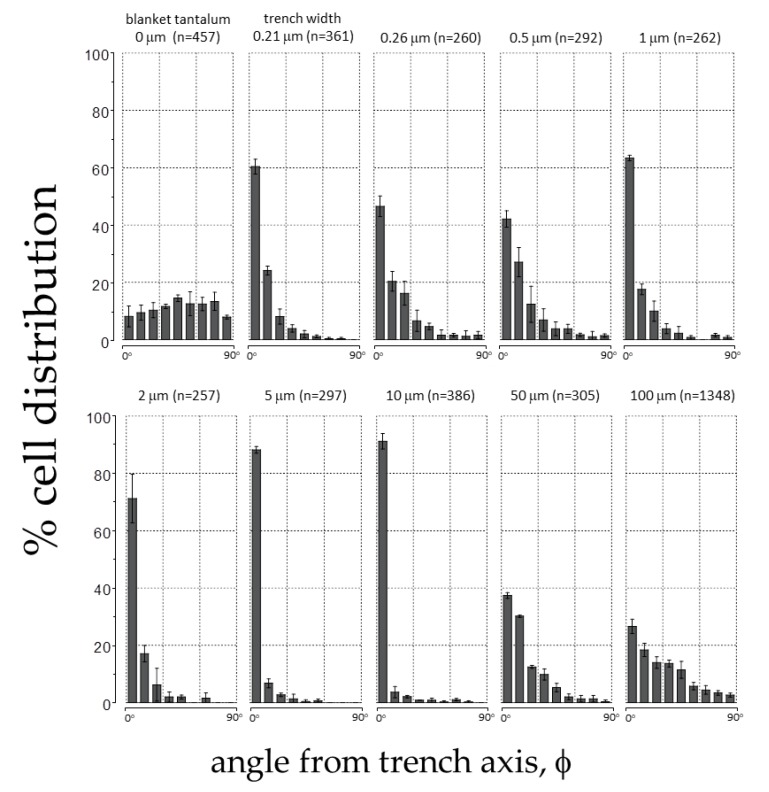
Figure 6.
Distribution of adherent cell orientation (in percentage) on blanket tantalum film and comb structures with trench widths between 0.21 μm and 100 μm. The cell orientation is characterized as the angle (φ) between the nuclei long axis and the patterned trench axes. The number of adherent cells characterized (n) in each area is also presented in the plots. Each bin represents the percentage of cell population in a ±10° interval deviated from the trench axis. Results show that cells aligned preferentially with the trench axes.

