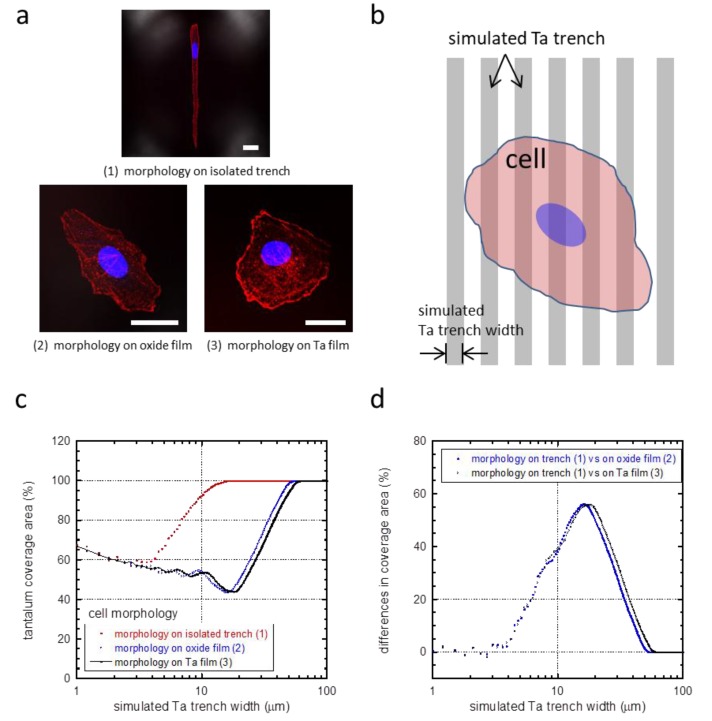
Figure 7.
(a) Cell morphologies that were used to calculate the tantalum coverage: (1) on isolated trenches, (2) on silicon oxide films, and (3) on tantalum (Ta) films. Scale bars correspond to 25 μm. A schematic drawing illustrating a model cell on simulated parallel trenches and lines is shown in (b). (c) Percent tantalum coverage calculated from our mathematical simulation of cells with three different morphologies. Tantalum coverage converged at trench widths smaller than 2 μm and larger than 60 μm for all morphologies. (d) Difference in tantalum coverage between elongated cell morphology (1) and a random-shaped cell morphology on blanket oxide (2) and tantalum films (3).

