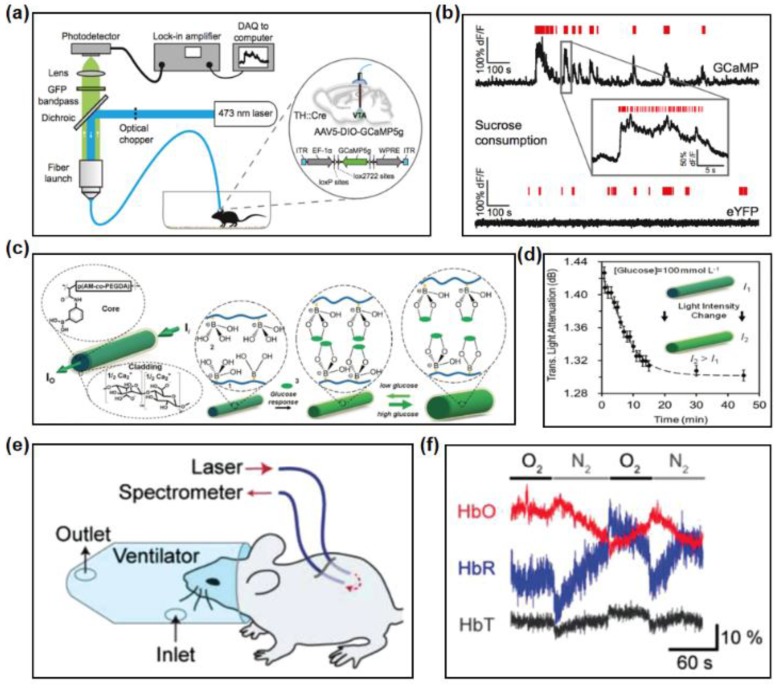
Figure 10.
Fibers and waveguides in optical-sensing. (a) A scheme diagram of a fiber photometry system. Reproduced with permission [23]. Copyright 2014, Elsevier. (b) Recorded signals from the VTA of mice expressing GCaMP (top) and eYFP (bottom). Reproduced with permission [23]. Copyright 2014, Elsevier. (c) Scheme of the glucose-sensitive optical fiber. Reproduced with permission [62]. Copyright 2017, Wiley-VCH. (d) Attenuation of the transmitted light through the glucose-sensitive optical fiber. Reproduced with permission [62]. Copyright 2017, Wiley-VCH. (e) Reflectance oximetry of biological tissues. Reproduced with permission [36]. Copyright 2015, Wiley-VCH (f) Variation of typical time-lapse of calculated concentrations of oxy-hemoglobin, deoxy-hemoglobin and total hemoglobin. Reproduced with permission [36]. Copyright 2015, Wiley-VCH.

