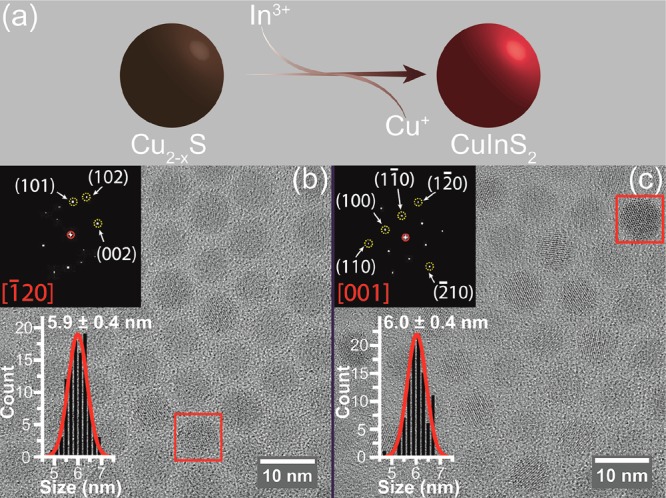
Figure 1.

(a) Schematic diagram of partial Cu+ for In3+ cation exchange in template Cu2–xS NCs. (b) High-resolution transmission electron microscopy (HRTEM) image and corresponding size histogram of 5.9 nm template Cu2–xS NCs (polydispersity of 6.8%). The inset shows the Fourier transform (FT) analysis of a single Cu2–xS NC indicated by a red rectangle, which can be indexed to [−120] axial projection of the high chalcocite Cu2S. (c) HRTEM image and corresponding size histogram of CIS QDs obtained by cation exchange using the Cu2–xS NCs shown in (b) as templates (see Methods for details). The size of the product CIS QDs is 6 nm with a polydispersity of 6.7%. The inset shows the FT analysis of a single CIS QD indicated by a red rectangle, which can be indexed to [001] axial projection of the wurtzite CIS. The size histograms are constructed by measuring over 200 NCs and are fitted to a Gaussian distribution function.
