
Figure 4.
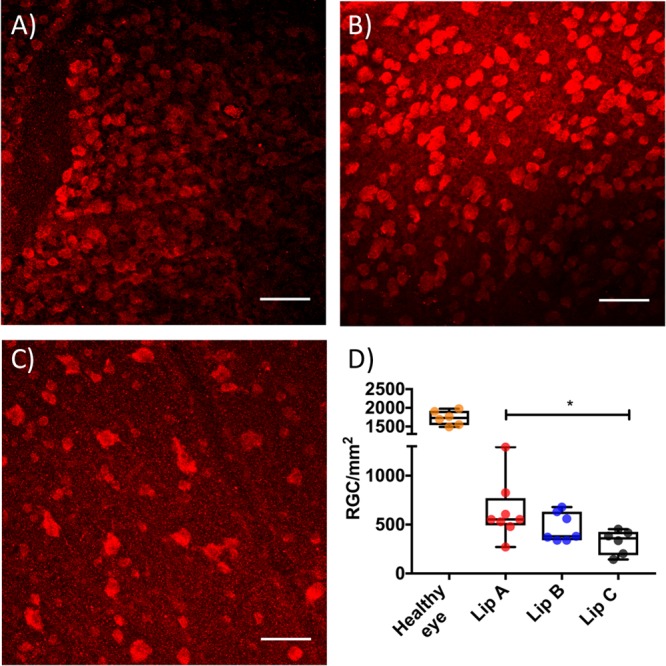
RGC rescue by liposomes after NMDA induced damage of mouse retinas. Example retina micrographs from (A) a healthy control eye; (B) a Lip A treated eye, and (C) a Lip C treated eye. In all micrographs RGCs nuclei were labeled with RBPMS Alexa647 (red), white scale bars are 60 μm. (D) Box and whiskers plot showing the density of surviving RGCs in healthy and liposome treated damaged eyes (*P ≤ 0.05 between Lip A and Lip C). Each dot shows an average RGC density for an eye, calculated from three micrographs taken 1 mm away from the optic nerve head. The box plot median values are 1728 RGCs/mm2 for the healthy eye, 553 RGCs/mm2 for Lip A, 380 RGCs/mm2 for Lip B, and 360 RGCs/mm2 for Lip C. N = 6–8 mice per group.