
Figure 6.
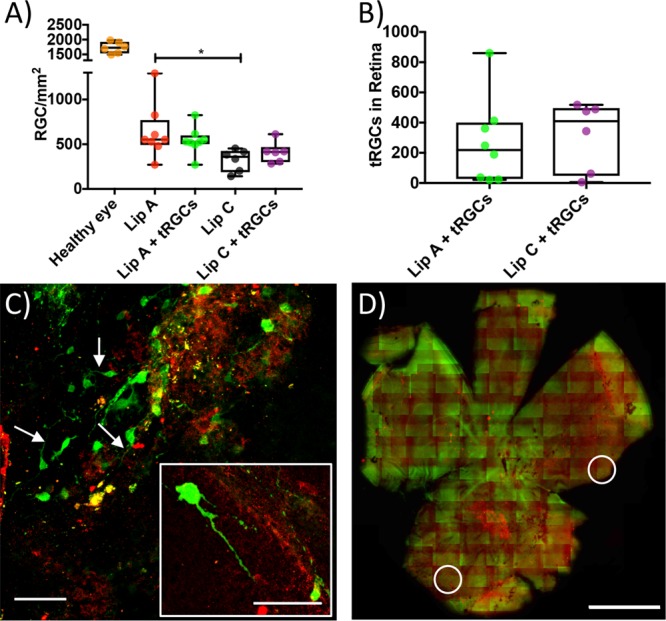
Host and transplant RGC survival. (A) Box and whiskers plot showing host RGC density in healthy eyes (median = 1728 cells/mm2) and NMDA damaged host eyes (median values for Lip A + tRGCs = 528 RGCs/mm2, Lip C = 360 RGCs/mm2, and Lip C + tRGCs = 415 RGCs/mm2) 4 weeks after NMDA injection (*P ≤ 0.05 between Lip A and Lip C). (B) Box and whiskers plot of tRGC survival in combination with liposomes (median values of 219 and 409 for Lip A and Lip C, respectively). (C) Example micrographs from the Lip A + tRGCs group. Transplant RGCs are in green, host RGCs in red (white arrows indicate axons, scale bar = 60 μm). The insert figure shows an example tRGC with axon (scale bar = 60 μm). (D) Example whole retina tile scan from the Lip A + tRGCs group used for cell counting. In all microscopy images tRGCs are in green (GFP) and host RGCs are in red (RBPMS). White circles highlight example areas containing tRGCs (scale bar = 1 mm, see Supplementary Figure S9 for larger image). N = 6–8 mice per group (panels A and B).