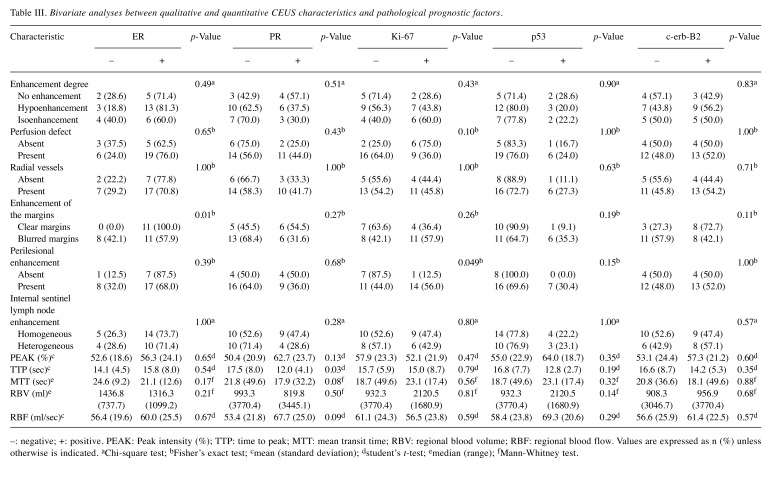
Table III. Bivariate analyses between qualitative and quantitative CEUS characteristics and pathological prognostic factors.
–: negative; +: positive. PEAK: Peak intensity (%); TTP: time to peak; MTT: mean transit time; RBV: regional blood volume; RBF: regional blood flow. Values are expressed as n (%) unless otherwise is indicated. aChi-square test; bFisher’s exact test; cmean (standard deviation); dstudent’s t-test; emedian (range); fMann-Whitney test.

