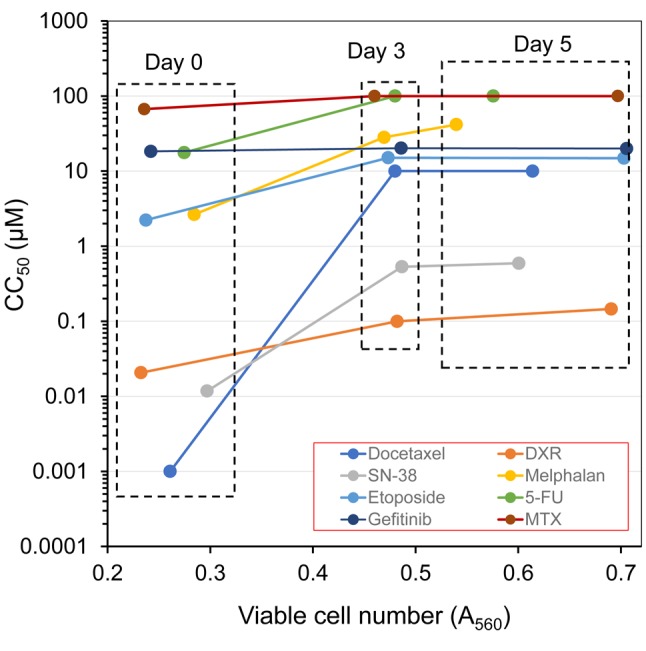
Figure 3. Relationship between cell density and viability. Drug sensitivity [evaluated by 50% cytotoxic concentration (CC50) value in left column of Table I] was plotted against cell density (A560) of control cells, measured at the time of cell harvest (determined by the MTT method) (right column of Table I).

