. 2018 Jul 3;32(4):771–781. doi: 10.21873/invivo.112307

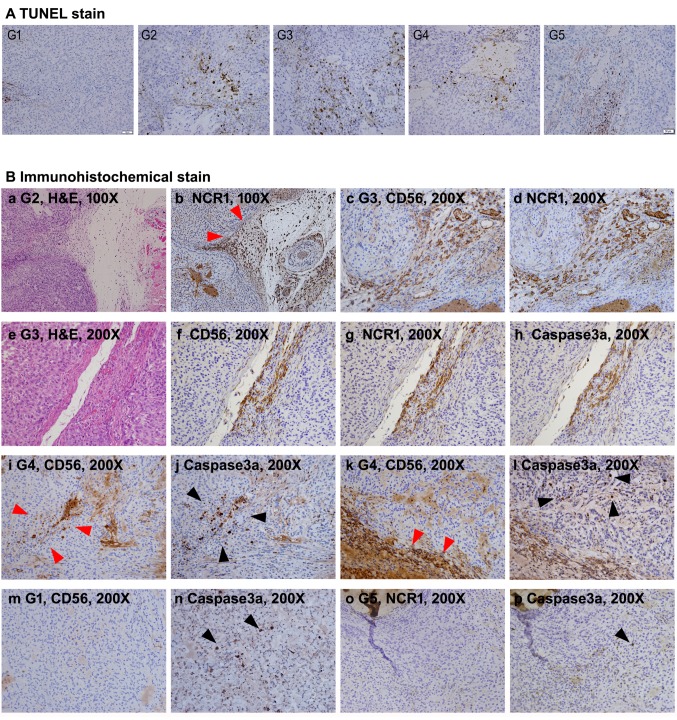
Figure 6. Histological observation of apoptotic tumor cells and infiltrating NK cells. A: TUNEL stains of all study group’s tumor sections. TUNELpositive cells were significantly more frequent in G2-G5 compared to G1. B: IHC experiments. a and b: Consecutive section images from G2 showing NCR1-positive NK cell infiltration (red arrowheads) along the loose tissue between tumor nodules. c and d: Consecutive section images from G3 showing precisely matched CD56 and NCR1-positive NK cells. e-h: Consecutive section images from G3. Apoptotic signals of the tumor cells detected by IHC with anti-human caspase 3a antibody are predominantly detected at the area with robust NK cell infiltration. i and j: Consecutive section images from G4. In the tumor, caspase3a-positive cells (black arrowheads) are detected at the vicinity where infiltrated NK cells are detected (red arrowheads). k and l: Consecutive section images from G4. Caspase3a-positive cells (black arrowheads) are located at the vicinity of NK cell infiltration (red arrowheads) along loose tissue between tumor nodules. m-p: Consecutive section images from G1 and G5 showing spotty caspase3apositive cells (black arrowheads) in the tumor irrelevant to NK cell infiltration .

Figure 6