Figure 1.
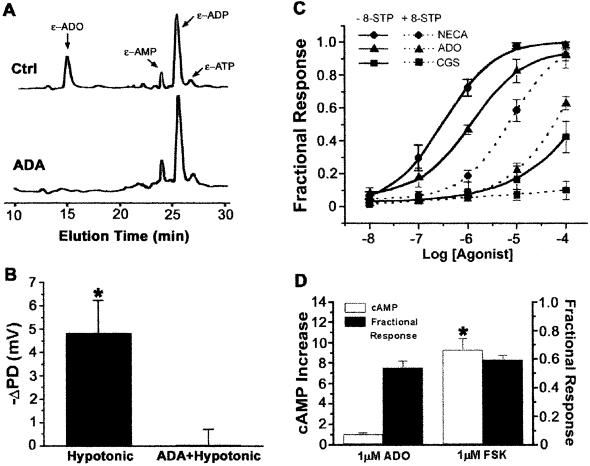
CFTR regulation by mucosal Ado. (A) HPLC profile of ethenoadenosine (ɛ-Ado) and its nucleotides in the mucosal surface liquid media of Calu-3 cells. The ɛ-adenosine peak was identified by ɛ-adenosine standards and by its sensitivity to 1 unit/ml adenosine deaminase (ADA). y axis, fluorescence in arbitrary units. The amount of ethenopurines in the total 0.5 ml of luminal surface liquid were as follows: ɛ-Ado, 16 pmol; ɛ-AMP, 9 pmol; ɛ-ADP, 28 pmol; and ɛ-ATP, 4 pmol. (B) Cl− secretory response to mucosal hypotonic challenge. (C) Cl− secretion by polarized Calu-3 cells in response to Ado and Ado analogs. Responses to cumulative increases in ligand concentration in the mucosal bath solution are expressed as a percent of the 10 μM forskolin response (solid lines). Dose–effect relationships were also performed in the presence the Ado receptor antagonist 8-(p-sulfophenyl)theophylline (8-SPT; 100 μM) (dashed lines). NECA, 5′-N-ethylcarboxamidoadenosine; CGS, CGS-21680 (n = 3). (D) cAMP accumulation and Cl− secretion. Cl− secretion stimulated by 1 μM Ado or 1 μM forskolin are expressed as a percent of the 10 μM forskolin response (Fractional Response) as in C. The intracellular cAMP concentrations are expressed as fold over control (n = 3 or 4). *, Different from control, P < 0.001.

