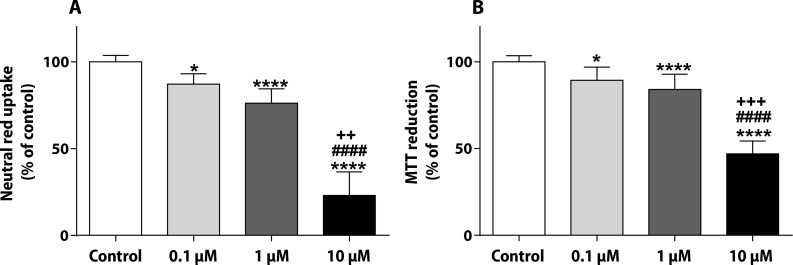
Figure 3.
PIX leads to lysosomal and mitochondrial damage in non-differentiated H9c2. NR uptake (A) and MTT reduction (B) assays in non-differentiated H9c2 cells exposed to 0.1, 1 or 10 μM PIX for 48 h. Values are expressed as percentage of control and are shown as mean ± standard deviation. The results were obtained from 4–5 independent experiments using 20–24 wells. The statistical analyses were made using the Kruskal-Wallis test, followed by the Dunn’s post-hoc test (*p<0.05 and ****p<0.0001 versus control; ####p<0.0001 versus PIX 0.1 μM; ++p<0.01, +++p<0.001 versus PIX 1 μM).

